Multi Time Frame Trend, Volume and Momentum ProfileWHAT DOES THIS INDICATOR DO?
I created this indicator to address some of the significant inconveniences when analyzing a security, such as continually switching between different time frames to determine the trend and potential pullbacks, adding volume or volume-derived indicators, and finally, something that would help me determine the strength of the trend (maybe two additional indicators here). So I decided to code this all-in-one indicator that you can add multiple times to your chart depending on the settings you want to use, or just optimize the parameters for the particular asset and then switch between the options.
As the name suggests, it consists of three main sections - Trend , Volume , and Momentum . You have complete control over the parameters, including the Time Frames you want to use for each one (they can be different). So, let me explain each section in more detail.
HOW DOES THE INDICATOR WORK?
1. Trend Settings
In order to determine the trend, you need to set up two Moving Averages. You have a wide choice here - SMA, EMA, WMA, RMA, HMA, DEMA, TEMA, VWMA, and ALMA. Since the indicator does not plot the moving averages on the chart, I strongly suggest using this indicator along with the free "Trend Indicator for Directional Trading(main)" , which you can find in the Public Library. Once you set up the Trend Resolution, the Types of MAs, and their lengths, the indicator will generate a histogram of their convergences and divergences.
The change in colors should help you more easily determine the trend:
a) Bright Green - bull trend and price trending up (a good place to open long)
b) Dark Green - bull trend and price trending down (stay flat or open a long position with great caution)
c) Bright Red - bear trend and price trending down (a good place to open short)
d) Dark Red - bear trend and price trending up (stay flat or open a short position with great caution)
e) In addition, you can change the color palette to reflect the bull/bear trend momentum by scrolling to the bottom and selecting "Color Based on Bull/Bear Momentum", but I will discuss this in more detail below.
This part of the indicator is useful for opening a trade in the direction of the trend or for spotting a potential divergence. Both cases are illustrated below.
2. Volume Settings
The calculations for this part of the indicator are partially taken from "Multi Time Frame Effective Volume Profile" . I will quickly outline the specifics here, but if you want a more thorough understanding of how it works, please check the description of the MTF Effective Volume Profile indicator .
You have three elements with the following default settings - Resolution (5-min), Lookback (100), and Average (1). This means that the indicator will analyze the last one hundred 5-min bars and will plot a sum of only those that are at least 1 times bigger than the average. Those that are smaller than the average will be left out from the calculation. What you get is a trend line showing you accumulation/distribution based on modified volume parameters.
This part of the indicator is useful for spotting exhaustions and increased buying/selling volume that is opposite to the price trend. As you will see in the picture below, in frame 1 the selling pressure is decreasing, while buying volume is increasing. At one point supply dries out and the bulls take control, thus reverting the price. In frame 2, however, you can see that the higher high is not met with nearly as much buying volume as in the previous peak, showing that the bulls are exhausted and maybe a trend change will follow or at the very least that the bull trend will take a break.
3. Momentum Settings
The final part is an RSI smoothed through a Moving Average with the addition of some minor optimizations. Thus, the parameters you have to configure here aside from the resolution are the RSI length, the moving average that will be used, and its length. Out of the three, this is the most lagging component, but it's also the most accurate one. I must mention that due to the modified nature of this RSI, overbought and oversold levels carry less weight to the trading signals. Rather, pay attention to the change of colors, as they do so when the RSI changes direction based on preset parameters. The picture below shows such instances.
4. Additional Settings
This section consists of 4 elements:
a) Length of Trend - filters out the noise and gives a signal only when the trend becomes more established
b) ADX Threshold - filters out trading ranges and indecision zones when it's not recommended to open a trade
c) Select Analysis - choose what part of the indicator you want to see from a drop-down menu
d) Color Based on Bull/Bear Momentum - a global setting that will override the preset coloring of each indicator and will replace it with colors based on bull/bear strength and momentum - green for bulls, red for bears, and gray for non-trading zones.
The last part of this indicator is a combination of all of the above and is called a Points-Based System . It generates 3 rows of dots that go light green when bull criteria are met, orange when bear criteria are met, or gray when it's neither of the two. When you get a column of 3 green dots you get a buy signal. Similarly, a column of 3 orange dots gives you a sell signal. Grey zones are non-tradeable. It goes without saying that the frequency and quality of the signals you get will almost entirely depend on your settings, so feel free to experiment and adjust the indicator to catch the best moves for the given security.
In terms of indicator adjustments, I have left almost every part open to configuration. That is 15 parameters and 35 adjustable colors.
HOW MUCH DOES THE INDICATOR COST ?
As much as I would like to offer it for free (as some of my other ones), a great deal of work, trading logic, and testing have gone into creating this indicator. More than a few hundred iterations and a few dozen branches were required to reach the end result which is a precise combination of usefulness, simplicity, and practicality. Furthermore, this indicator will continue to be updated and user-requested features that improve its performance will be added.
Disclaimer: The purpose of all indicators is to indicate potential setups, which may lead to profitable results. No indicator is perfect and certainly, no indicator has a 100% success rate. They are subject to flaws, wrongful interpretation, bugs, etc. This indicator makes no exception. It must be used with a sound money management plan that puts the main emphasis on protecting your capital. Please, do not rely solely on any single indicator to make trading decisions instead of you. Indicators are storytellers, not fortune tellers. They help you see the bigger picture, not the future.
To find out more about how to gain access to this indicator, please use the provided information below or just message me. Thank you for your time.
在腳本中搜尋"volume profile"

VPoC per barThis study prints the current bar VPoC as an horizontal line.
It's aimed originally at BTCUSDT pair and 15m timeframe.
HOW IT WORKS
Zoom In mode: This is the default mode.
The study zooms in into the latest 15 1-minute bar candles in order to calculate the 15 minute candle VPoC.
Zoom Out mode: The VPoC from the last n bars from the current timeframe that match desired timeframe is shown on each bar.
In either case you are recommended to click on the '...' button associated to this study
and select 'Visual Order. Bring to Front.' so that it's properly shown in your chart.
HOW IT WORKS - Zoom In mode
Make sure that '(VP) Zoom into the VP timeframe' setting is set to true.
Choose the zoomed in timeframe where to calculate VPoC from thanks to the '(VP) Zoomed timeframe {1 minute}' setting.
Change '(VP) Zoomed in timeframe bars per current timeframe bar {15}' to its appropiated value. You just need to divide the current timeframe minutes per the zoomed in timeframe minutes per bar. E.g. If you are in 60 minute timeframe and you want to zoom in into 5 minute timeframe: 60 / 5 = 12 . You will write 12 here.
HOW IT WORKS - Zoom Out mode
Make sure that '(VP) Zoom into the VP timeframe' setting is set to false.
If you are using the Zoom out mode you might want to set '(VP) Print VPoC price as discrete lines {True}' to false.
Either choose the zoommed out timeframe where to calculate VPoC from thanks to the '(VP) Zoomed timeframe {1 minute}' setting or turn on the '(VP) Use number of bars (not VP timeframe)' setting in order to use '(VP) Number of bars {100}' as a custom number of bars.
WARNING - Zoom In mode last bar
The way that PineScript handles security function in last bar might result on the last bar not being accurate enough.
SETTINGS
__ SETTINGS - Volume Profile
(VP) Zoomed timeframe {1 minute}: Timeframe in which to zoom in or zoom out to calculate an accurate VPoC for the current timeframe.
(VP) Zoomed in timeframe bars per current timeframe bar {15}: Check 'HOW IT WORKS - Zoom In mode' above. Note : It is only used in 'Zoom in' mode.
(VP) Number of bars {100}: If 'Use number of bars (not VP timeframe)' is turned on this setting is used to calculate session VPoC. Note : It is only used in 'Zoom out' mode.
(VP) Price levels {24}: Price levels for calculating VPoC.
__ SETTINGS - MAIN TURN ON/OFF OPTIONS
(VP) Print VPoC price {True}: Show VPoC price
(VP) Zoom into the VP timeframe: When set to true the VPoC is calculated by zooming into the lower timeframe. When set to false a higher timeframe (or number of bars) is used.
(VP) Realtime Zoom in (Beta): Enable real time zoom for the last bar. It's beta because it would only work with zoomed in timeframe under 60 minutes. And when ratio between zoomout and zoomin is less than 60. Note : It is only used in 'Zoom in' mode.
(VP) Use number of bars (not VP timeframe): Uses 'Number of bars {100}' setting instead of 'Volume Profile timeframe' setting for calculating session VPoC. Note : It is only used in 'Zoom out' mode.
(VP) Print VPoC price as discrete lines {True}: When set to true the VPoC is shown as an small line in the center of each bar. When set to the false the VPoC line is printed as a normal line.
__ SETTINGS - EXTRA
(VP) VPoC color: Change the VPoC color
(VP) VPoC line width {1}: Change VPoC line width (in pixels).
(VP) Use number of bars (not VP timeframe): Uses 'Number of bars {100}' setting instead of 'Volume Profile timeframe' setting for calculating session VPoC. Note : It is only used in 'Zoom out' mode.
(VP) Print VPoC price as discrete lines {True}: When set to true the VPoC is shown as an small line in the center of each bar. When set to the false the VPoC line is printed as a normal line.
CREDITS
I have reused and adapted some code from
"Poor man's volume profile" study
which it's from TradingView IldarAkhmetgaleev user.

Bar Balance [LucF]Bar Balance extracts the number of up, down and neutral intrabars contained in each chart bar, revealing information on the strength of price movement. It can display stacked columns representing raw up/down/neutral intrabar counts, or an up/down balance line which can be calculated and visualized in many different ways.
WARNING: This is an analysis tool that works on historical bars only. It does not show any realtime information, and thus cannot be used to issue alerts or for automated trading. When realtime bars elapse, the indicator will require a browser refresh, a change to its Inputs or to the chart's timeframe/symbol to recalculate and display information on those elapsed bars. Once a trader understands this, the indicator can be used advantageously to make discretionary trading decisions.
Traders used to work with my Delta Volume Columns Pro will feel right at home in this indicator's Inputs . It has lots of options, allowing it to be used in many different ways. If you value the bar balance information this indicator mines, I hope you will find the time required to master the use of Bar Balance well worth the investment.
█ OVERVIEW
The indicator has two modes: Columns and Line .
Columns
• In Columns mode you can display stacked Up/Down/Neutral columns.
• The "Up" section represents the count of intrabars where `close > open`, "Down" where `close < open` and "Neutral" where `close = open`.
• The Up section always appears above the centerline, the Down section below. The Neutral section overlaps the centerline, split halfway above and below it.
The Up and Down sections start where the Neutral section ends, when there is one.
• The Up and Down sections can be colored independently using 7 different methods.
• The signal line plotted in Line mode can also be displayed in Columns mode.
Line
• Displays a single balance line using a zero centerline.
• A variable number of independent methods can be used to calculate the line (6), determine its color (5), and color the fill (5).
You can thus evaluate the state of 3 different components with this single line.
• A "Divergence Levels" feature will use the line to automatically draw expanding levels on divergence events.
Features available in both modes
• The color of all components can be selected from 15 base colors, with 16 gradient levels used for each base color in the indicator's gradients.
• A zero line can show a 6-state aggregate value of the three main volume balance modes.
• The background can be colored using any of 5 different methods.
• Chart bars can be colored using 5 different methods.
• Divergence and large neutral count ratio events can be shown in either Columns or Line mode, calculated in one of 4 different methods.
• Markers on 6 different conditions can be displayed.
█ CONCEPTS
Intrabar inspection
Intrabar inspection means the indicator looks at lower timeframe bars ( intrabars ) making up a given chart bar to gather its information. If your chart is on a 1-hour timeframe and the intrabar resolution determined by the indicator is 5 minutes, then 12 intrabars will be analyzed for each chart bar and the count of up/down/neutral intrabars among those will be tallied.
Bar Balances and calculation methods
The indicator uses a variety of methods to evaluate bar balance and to derive other calculations from them:
1. Balance on Bar : Uses the relative importance of instant Up and Down counts on the bar.
2. Balance Averages : Uses the difference between the EMAs of Up and Down counts.
3. Balance Momentum : Starts by calculating, separately for both Up and Down counts, the difference between the same EMAs used in Balance Averages and an SMA of double the period used for the EMAs. These differences are then aggregated and finally, a bounded momentum of that aggregate is calculated using RSI.
4. Markers Bias : It sums the bull/bear occurrences of the four previous markers over a user-defined period (the default is 14).
5. Combined Balances : This is the aggregate of the instant bull/bear bias of the three main bar balances.
6. Dual Up/Down Averages : This is a display mode showing the EMA calculated for each of the Up and Down counts.
Interpretation of neutral intrabars
What do neutral intrabars mean? When price does not change during a bar, it can be because there is simply no interest in the market, or because of a perfect balance between buyers and sellers. The latter being more improbable, Bar Balance assumes that neutral bars reveal a lack of interest, which entails uncertainty. That is the reason why the option is provided to interpret ratios of neutral intrabars greater than 50% as divergences. It is also the rationale behind the option to dampen signal lines on the inverse ratio of neutral intrabars, so that zero intrabars do not affect the signal, and progressively larger proportions of neutral intrabars will reduce the signal's amplitude, as the balance calcs using the up/down counts lose significance. The impact of the dampening will vary with markets. Weaker markets such as cryptos will often contain greater numbers of neutral intrabars, so dampening the Line in that sector will have a greater impact than in more liquid markets.
█ FEATURES
1 — Columns
• While the size of the Up/Down columns always represents their respective importance on the bar, their coloring mode is independent. The default setup uses a standard coloring mode where the Up/Down columns over/under the zero line are always in the bull/bear color with a higher intensity for the winning side. Six other coloring modes allow you to pack more information in the columns. When choosing to color the top columns using a bull/bear gradient on Balance Averages, for example, you will end up with bull/bear colored tops. In order for the color of the bottom columns to continue to show the instant bar balance, you can then choose the "Up/Down Ratio on Bar — Dual Solid Colors" coloring mode to make those bars the color of the winning side for that bar.
• Line mode shows only the line, but Columns mode allows displaying the line along with it. If the scale of the line is different than that of the scale of the columns, the line will often appear flat. Traders may find even a flat line useful as its bull/bear colors will be easily distinguishable.
2 — Line
• The default setup for Line mode uses a calculation on "Balance Momentum", with a fill on the longer-term "Balance Averages" and a line color based on the "Markers Bias". With the background set on "Line vs Divergence Levels" and the zero line on the hard-coded "Combined Bar Balances", you have access to five distinct sources of information at a glance, to which you can add divergences, divergences levels and chart bar coloring. This provides powerful potential in displaying bar balance information.
• When no columns are displayed, Line mode can show the full scale of whichever line you choose to calculate because the columns' scale no longer interferes with the line's scale.
• Note that when "Balance on Bar" is selected, the Neutral count is also displayed as a ratio of the balance line. This is the only instance where the Neutral count is displayed in Line mode.
• The "Dual Up/Down Averages" is an exception as it displays two lines: one average for the Up counts and another for the Down counts. This mode will be most useful when Columns are also displayed, as it provides a reference for the top and bottom columns.
3 — Zero Line
The zero line can be colored using two methods, both based on the Combined Balances, i.e., the aggregate of the instant bull/bear bias of the three main bar balances.
• In "Six-state Dual Color Gradient" mode, a dot appears on every bar. Its color reflects the bull/bear state of the Combined Balances, and the dot's brightness reflects the tally of balance biases.
• In "Dual Solid Colors (All Bull/All Bear Only)" a dot only appears when all three balances are either bullish or bearish. The resulting pattern is identical to that of Marker 1.
4 — Divergences
• Divergences are displayed as a small circle at the top of the scale. Four different types of divergence events can be detected. Divergences occur whenever the bull/bear bias of the method used diverges with the bar's price direction.
• An option allows you to include in divergence events instances where the count of neutral intrabars exceeds 50% of the total intrabar count.
• The divergence levels are dynamic levels that automatically build from the line's values on divergence events. On consecutive divergences, the levels will expand, creating a channel. This implementation of the divergence levels corresponds to my view that divergences indicate anomalies, hesitations, points of uncertainty if you will. It excludes any association of a pre-determined bullish/bearish bias to divergences. Accordingly, the levels merely take note of divergence events and mark those points in time with levels. Traders then have a reference point from which they can evaluate further movement. The bull/bear/neutral colors used to plot the levels are also congruent with this view in that they are determined by price's position relative to the levels, which is how I think divergences can be put to the most effective use.
5 — Background
• The background can show a bull/bear gradient on four different calculations. You can adjust its brightness to make its visual importance proportional to how you use it in your analysis.
6 — Chart bars
• Chart bars can be colored using five different methods.
• You have the option of emptying the body of bars where volume does not increase, as does my TLD indicator, the idea behind this being that movement on bars where volume does not increase is less relevant.
7 — Intrabar Resolution
You can choose between three modes. Two of them are automatic and one is manual:
a) Fast, Longer history, Auto-Steps (~12 intrabars) : Optimized for speed and deeper history. Uses an average minimum of 12 intrabars.
b) More Precise, Shorter History Auto-Steps (~24 intrabars) : Uses finer intrabar resolution. It is slower and provides less history. Uses an average minimum of 24 intrabars.
c) Fixed : Uses the fixed resolution of your choice.
Auto-Steps calculations vary for 24/7 and conventional markets in order to achieve the proper target of minimum intrabars.
You can choose to view the intrabar resolution currently used to calculate delta volume. It is the default.
The proper selection of the intrabar resolution is important. It must achieve maximal granularity to produce precise results while not unduly slowing down calculations, or worse, causing runtime errors.
8 — Markers
Six markers are available:
1. Combined Balances Agreement : All three Bar Balances are either bullish or bearish.
2. Up or Down % Agrees With Bar : An up marker will appear when the percentage of up intrabars in an up chart bar is greater than the specified percentage. Conditions mirror to down bars.
3. Divergence confirmations By Price : One of the four types of balance calculations can be used to detect divergences with price. Confirmations occur when the bar following the divergence confirms the balance bias. Note that the divergence events used here do not include neutral intrabar events.
4. Balance Transitions : Bull/bear transitions of the selected balance.
5. Markers Bias Transitions : Bull/bear transitions of the Markers Bias.
6. Divergence Confirmations By Line : Marks points where the line first breaches a divergence level.
Markers appear when the condition is detected, without delay. Since nothing is plotted in realtime, markers do not appear on the realtime bar.
9 — Settings
• Two modes can be selected to dampen the line on the ratio of neutral intrabars.
• A distinct weight can be attributed to the count of the latter half of intrabars, on the assumption that later intrabars may be more important in determining the outcome of chart bars.
• Allows control over the periods of the different moving averages used in calculations.
• The default periods used for the various calculations define the following hierarchy from slow to fast:
Balance Averages: 50,
Balance Momentum: 20,
Dual Up/Down Averages: 20,
Marker Bias: 10.
█ LIMITATIONS
• This script uses a special characteristic of the `security()` function allowing the inspection of intrabars—which is not officially supported by TradingView.
• The method used does not work on the realtime bar—only on historical bars.
• The indicator only works on some chart resolutions: 3, 5, 10, 15 and 30 minutes, 1, 2, 4, 6, and 12 hours, 1 day, 1 week and 1 month. The script’s code can be modified to run on other resolutions, but chart resolutions must be divisible by the lower resolution used for intrabars and the stepping mechanism could require adaptation.
• When using the "Line vs Divergence Levels — Dual Color Gradient" color mode to fill the line, background or chart bars, keep in mind that a line calculation mode must be defined for it to work, as it determines gradients on the movement of the line relative to divergence levels. If the line is hidden, it will not work.
• When the difference between the chart’s resolution and the intrabar resolution is too great, runtime errors will occur. The Auto-Steps selection mechanisms should avoid this.
• Alerts do not work reliably when `security()` is used at intrabar resolutions. Accordingly, no alerts are configured in the indicator.
• The color model used in the indicator provides for fancy visuals that come at a price; when you change values in Inputs , it can take 20 seconds for the changes to materialize. Luckily, once your color setup is complete, the color model does not have a large performance impact, as in normal operation the `security()` calls will become the most important factor in determining response time. Also, once in a while a runtime error will occur when you change inputs. Just making another change will usually bring the indicator back up.
█ RAMBLINGS
Is this thing useful?
I'll let you decide. Bar Balance acts somewhat like an X-Ray on bars. The intrabars it analyzes are no secret; one can simply change the chart's resolution to see the same intrabars the indicator uses. What the indicator brings to traders is the precise count of up/down/neutral intrabars and, more importantly, the calculations it derives from them to present the information in a way that can make it easier to use in trading decisions.
How reliable is Bar Balance information?
By the same token that an up bar does not guarantee that more up bars will follow, future price movements cannot be inferred from the mere count of up/down/neutral intrabars. Price movement during any chart bar for which, let's say, 12 intrabars are analyzed, could be due to only one of those intrabars. One can thus easily see how only relying on bar balance information could be very misleading. The rationale behind Bar Balance is that when the information mined for multiple chart bars is aggregated, it can provide insight into the history behind chart bars, and thus some bias as to the strength of movements. An up chart bar where 11/12 intrabars are also up is assumed to be stronger than the same up bar where only 2/12 intrabars are up. This logic is not bulletproof, and sometimes Bar Balance will stray. Also, keep in mind that balance lines do not represent price momentum as RSI would. Bar Balance calculations have no idea where price is. Their perspective, like that of any historian, is very limited, constrained that it is to the narrow universe of up/down/neutral intrabar counts. You will thus see instances where price is moving up while Balance Momentum, for example, is moving down. When Bar Balance performs as intended, this indicates that the rally is weakening, which does necessarily imply that price will reverse. Occasionally, price will merrily continue to advance on weakening strength.
Divergences
Most of the divergence detection methods used here rely on a difference between the bias of a calculation involving a multi-bar average and a given bar's price direction. When using "Bar Balance on Bar" however, only the bar's balance and price movement are used. This is the default mode.
As usual, divergences are points of interest because they reveal imbalances, which may or may not become turning points. I do not share the overwhelming enthusiasm traders have for the purported ability of bullish/bearish divergences to indicate imminent reversals.
Superfluity
In "The Bed of Procrustes", Nassim Nicholas Taleb writes: To bankrupt a fool, give him information . Bar Balance can display lots of information. While learning to use a new indicator inevitably requires an adaptation period where we put it through its paces and try out all its options, once you have become used to Bar Balance and decide to adopt it, rigorously eliminate the components you don't use and configure the remaining ones so their visual prominence reflects their relative importance in your analysis. I tried to provide flexible options for traders to control this indicator's visuals for that exact reason—not for window dressing.
█ NOTES
For traders
• To avoid misleading traders who don't read script descriptions, the indicator shows nothing in the realtime bar.
• The Data Window shows key values for the indicator.
• All gradients used in this indicator determine their brightness intensities using advances/declines in the signal—not their relative position in a fixed scale.
• Note that because of the way gradients are optimized internally, changing their brightness will sometimes require bringing down the value a few steps before you see an impact.
• Because this indicator does not use volume, it will work on all markets.
For coders
• For those interested in gradients, this script uses an advanced version of the Advance/Decline gradient function from the PineCoders Color Gradient (16 colors) Framework . It allows more precise control over the range, steps and min/max values of the gradients.
• I use the PineCoders Coding Conventions for Pine to write my scripts.
• I used functions modified from the PineCoders MTF Selection Framework for the selection of timeframes.
█ THANKS TO:
— alexgrover who helped me think through the dampening method used to attenuate signal lines on high ratios of neutral intrabars.
— A guy called Kuan who commented on a Backtest Rookies presentation of their Volume Profile indicator . The technique I use to inspect intrabars is derived from Kuan's code.
— theheirophant , my partner in the exploration of the sometimes weird abysses of `security()`’s behavior at intrabar resolutions.
— midtownsk8rguy , my brilliant companion in mining the depths of Pine graphics. He is also the co-author of the PineCoders Color Gradient Frameworks .

Volume Squeeze Momentum by HypesterTradingview is basically composed by reskins of many great contributors such as Chrismood, Lazybear, RicardoSandos and a few others. Without those guys I would not be able to learn how to code PINE - since the "documentation" is horrible and support is basically also non-existent. So thank you!
So here is another contribution to the community, which I chose to not disclose the code since the community usually reskin the code and do not give credit and this code is 100% mine.
I believe that the volume tools available are poor and lagging so here is my contribution.
I use this tool to filter noise and eliminate fake reversal signals, momentum readings and trend changes on my Spectro M. Use at your own risk.
I've added some pre-set volume profiles and trend configs. Also, the bar colors for ease of use, and all of that can be easily turned on/off and changed in the config menu.
Let me know what you think!

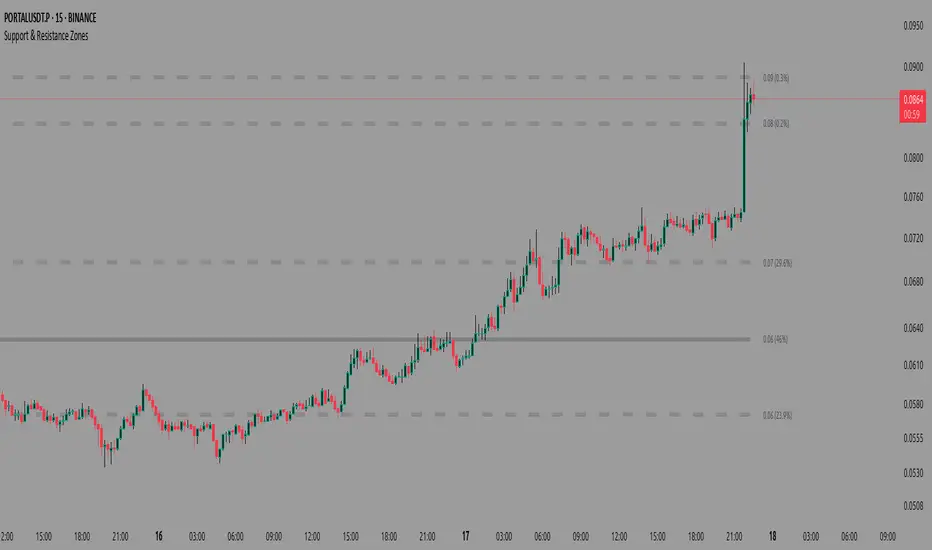
Support & Resistance ZonesAdvanced Support & Resistance Detection Algorithm
This indicator identifies meaningful price levels by analyzing market structure using a proprietary statistical approach. Unlike traditional methods that rely on simple swing highs/lows or moving averages, this system dynamically detects zones where price has shown consistent interaction, revealing true areas of supply and demand.
Core Methodology
Price Data Aggregation
Collects highs and lows over a configurable lookback period.
Normalizes price data to account for volatility, ensuring levels remain relevant across different market conditions.
Statistical Significance Filtering
Rejection of random noise: Eliminates insignificant price fluctuations using adaptive thresholds.
Volume-weighted analysis (implied): Stronger reactions at certain price levels are given higher priority, even if volume data is unavailable.
Dynamic Level Extraction
Density-based S/R Zones: Instead of fixed swing points, the algorithm identifies zones where price has repeatedly consolidated.
Time decay adjustment: Recent price action has more influence, ensuring levels adapt to evolving market structure.
Strength Quantification
Each level is assigned a confidence score based on:
Touch frequency: How often price revisited the zone.
Reaction intensity: The magnitude of bounces/rejections.
Time relevance: Whether the level remains active or has been broken decisively.
Adaptive Level Merging & Pruning
Proximity-based merging: If two levels are too close (within a volatility-adjusted threshold), they combine into one stronger zone.
Decay mechanism: Old, untested levels fade away if price no longer respects them.
Why This Approach Works Better Than Traditional Methods
✅ No subjective drawing required – Levels are generated mathematically, removing human bias.
✅ Self-adjusting sensitivity – Works equally well on slow and fast-moving markets.
✅ Focuses on statistically meaningful zones – Avoids false signals from random noise.
✅ Non-repainting & real-time – Levels only update when new data confirms their validity.
How Traders Can Use These Levels
Support/Resistance Trading: Fade bounces off strong levels or trade breakouts with confirmation.
Confluence with Other Indicators: Combine with RSI, MACD, or volume profiles for higher-probability entries.
Stop Placement: Place stops just beyond key levels to avoid premature exits.
Technical Notes (For Advanced Users)
The algorithm avoids overfitting by dynamically adjusting zones sensitivity based on market conditions.
Unlike fixed pivot points, these levels adapt to trends, making them useful in both ranging and trending markets.
The strength percentage helps filter out weak levels—only trade those with a high score for better accuracy.
Note: Script takes some time to load.
Radi IQ [TradingIQ]Introducing "Radi IQ".
Radi IQ is a comprehensive market structure indicator designed to provide traders with a detailed view of key price levels and market behavior. It combines several analytical methods—including internal and external structure analysis, fair value gaps, order blocks, breaker blocks, rejection blocks, premium discount zones, equal levels, directional liquidity grabs, and trend meters —to help users better understand areas of support and resistance, potential turning points, and liquidity events in the market.
Key Components and Their Functions
Market Structure Analysis
Internal and External Structure : The indicator evaluates market structure on two levels. The internal analysis focuses on immediate price action (e.g., recent support/resistance and swing points), while the external analysis uses a higher timeframe to provide context. This dual approach helps to confirm the strength of key levels by comparing short-term moves with the broader market trend.
Break of Structure (BoS) and Change of Character (CHoCH) : These signals highlight moments when the market shifts its behavior. A BoS indicates that a previous level of support or resistance has been overcome, while a CHoCH signals a change in the market’s character. Both are marked clearly on the chart using distinct color codes.
Break of Structure + (BoS+) and Change of Character + (CHoCH+) : These signals highlight moments when the market shifts its behavior and is confirmed by prior price action. A BoS + indicates that a previous level of support or resistance has been overcome, while price action achieves higher highs and higher lows (resistance break) or lower highs and lower lows (support break). CHoCH + signals a change in the market’s character when supported by prior price action - lower highs for a support break and higher lows for a resistance break.
BoS and CHoCH
The image above shows BoS and CHoCH identified on the price chart, and explains what each signifies.
A Break Of Structure (BoS) occurs when price decisively moves beyond a previously established support or resistance level. It indicates that the current trend or market pattern is being challenged, and the market may be ready to change direction.
A Change of Character (CHoCH) describes a shift in how the market behaves. A CHoCH occurs when, in an uptrend, a previously established support level breaks, or in a downtrend, a previously established resistance level breaks.
This break indicates that the market's typical structure is shifting, suggesting that the current trend may be losing its strength and that a reversal or a new trend could be developing.
CHoCH+
The image above explains CHoCH+ and how it forms, while highlighting an instance where a downside CHoCH+ formed following lower highs.
A Change of Character + (CHoCH+) describes a shift in how the market behaves that is supported by prior price action. For support breaks, price must form lower highs before breaking support.
The image above explains CHoCH+ for resistance breaks, while highlighting an instance where a resistance point broke that was supported by prior price action.
BoS+
The image above explains BoS+ and how it forms, while highlighting an instance where an upside BoS+ formed following higher highs and higher lows.
A BoS+ resistance break requires higher highs and higher lows prior to the resistance point being closed over.
The image above explains BoS+ support break, while highlighting an instance where a downside BoS+ formed following lower highs and lower lows.
A BoS+ support break requires lower highs and lower lows prior to the support point being closed under.
Future BoS and CHoCH
Radi IQ also displays where the next BoS and CHoCH points are located.
The image above shows the feature in action. With this, traders will always know where the next key support/resistance breakpoints are before they actually occur.
Fair Value Gaps (FVG)
The indicator identifies gaps in the price where little or no trading occurred—known as fair value gaps. These gaps can act as temporary support or resistance and may indicate areas where the market is likely to correct. FVGs are displayed with clear color gradients that differentiate between upward and downward gaps.
The image above shows an identified upside FVG. In the image, the identified upside FVG acted as a support point for price.
The image above shows an identified downside FVG. In the image, the identified downside FVG acted as a resistance point for price.
Low Volume FVG
In addition to identifying trading FVGs - Radi IQ can also specifically detect low volume fair value gaps. Ideally, these fair value gaps will form inside a low volume node on a volume profile.
Low volume node FVGs are important because these are areas where very little trading occurred and is confirmable, indicating an imbalance in supply and demand. Since few trades took place there, the market often moves quickly through these zones when revisited, which can lead to rapid price changes. This "gap" in trading activity can serve as a signal for potential reversals or fast moves, offering opportunities to enter or exit positions based on expected market behavior.
The image above shows identified FVGs that formed on low volume.
Large Area FVGs
Radi IQ is also capable of filtering out “inconsequential” FVGs. With this, Radi IQ can be enabled to only mark FVGs that cover a wide price range.
The image above shows the feature enabled, and all identified FVGs formed with a wide price range.
Large Area FVGs and Low Volume FVGs Combined
Traders can also enable Radi IQ to only mark FVGs that form on low volume and have a wide price range - allowing traders to only identify the highest quality FVGs on the chart.
Order Blocks and Premium Discount Zones
Order Blocks: Radi IQ detects areas where large orders have previously been placed by institutional traders. These blocks can act as strong levels of support or resistance, and the indicator marks bullish and bearish order blocks with dedicated colors.
What is an order block?
Order blocks are clusters of orders that institutions have executed to enter or exit a market position. They typically form when there is a period of consolidation before a significant move. For example, the last bullish candle before a strong down move may indicate a supply order block, while the last bearish candle before a sharp rally might be considered a demand order block.
Why They Form:
Institutions don’t trade in small, sporadic amounts; they accumulate or distribute large volumes of an asset. To avoid slippage and minimize market impact, they execute these orders over a zone rather than at a single price point. This creates a recognizable “block” on the chart.
Order Block Identification Types
Strength Score
The “Strength Score” order block detection mode is a TradingIQ proprietary ranking system for identified order blocks.
Purpose
The purpose of the “Strength Score” ranking system is to determine the “strength” or significance of an order block and rate the zone’s likelihood to act as support/resistance when retested in the future.
The scoring system ranks from 0 - 10, with “0” indicating a “weak” score or low likelihood of acting as a key support/resistance level when retested in the future.
A rating of “5” indicates a “moderate” score, indicating that the order block has a moderate likelihood of acting as a key support/resistance level when retested in the future.
A rating of “10” indicates a “strong” score, indicating that the order block has a strong likelihood of acting as a key support/resistance level when retested in the future.
How It Works
The score is calculated by examining the price move following the formation of an order block. The stronger the price move after an order block forms - the higher the Strength Score.
The image above shows a bearish order block with a score of “5” identified on the chart. The order block successfully operates as a resistance point when retested.
The image above shows a bullish order block with a score of “5” identified on the chart. The order block successfully operates as a resistance point when retested.
Volume-Based
The volume-based order block detection method detects traditional order blocks, but goes one step further by identifying the highest concentration point of volume for the bar and drawing the order block around this concentration point.
Key features when using the volume-based order block detection method:
The top of the order block is anchored to the top of the highest volume concentration point of the bar
The bottom of the order block is anchored to the bottom of the highest volume concentration point of the bar
The total volume that went into creation of the order block is displayed on the chart
The total volume of the order block is recorded as a percentage relative to the total volume for all order blocks on the chart
The image above shows the detection method in action.
Breaker Blocks
A breaker block is a specific type of order block that gains significance when price breaks through it and then often retests the level as a new area of support or resistance. Essentially, it’s a zone where, after the initial break, the previous level (which once acted as strong support or resistance) flips roles. For example, in an uptrend, if the price falls below a key support level, that level can become a breaker block and act as resistance if the price tries to move back up. Conversely, in a downtrend, a broken resistance level can serve as new support. Traders monitor breaker blocks because they often mark a shift in market sentiment and can provide potential entry or exit points once the market re-engages with these levels.
The image above shows a breaker block above price acting as resistance.
The image above shows a breaker block below price acting as support.
Rejection Blocks
A rejection block is a price area where the market shows a strong unwillingness to move beyond a certain level. This typically happens when price approaches a specific level but then is quickly rejected, leading to a bounce in the opposite direction. In other words, a rejection block forms when traders' orders create a barrier, causing the price to reverse rather than break through. Traders watch these areas closely, as they often signal a strong concentration of supply or demand that could provide potential entry or exit points for trades.
The image above shows both a verified upside rejection block acting as resistance, and an untested downside rejection block.
Rejection blocks are expected to function as strong support/resistance points when retested in the future.
Premium Discount Zones
Premium Discount Zones : These zones reflect areas where price is trading above (premium) or below (discount) a fair value range. They help traders gauge whether the current market price is relatively high or low compared to historical averages.
Premium Discount Zones account for recent swing highs and lows to calculate a fair value along with discount and premium prices over an intermediate time window.
The image above shows the premium and discount price zones in action.
Equal Levels
The indicator also tracks and highlights equal levels, which occur when the market repeatedly tests the same price levels. Equal levels can reinforce the significance of a support or resistance area and are represented by their own set of color markers.
The image above shows Radi IQ distinguishing equal highs and equal lows.
Equal Highs
When you see two or more highs that are approximately the same, it suggests that the market is repeatedly rejecting attempts to push higher. This signals a strong resistance level where sellers (or stop-hunters) are active.
Equal Lows
Similarly, consecutive lows at the same level indicate strong support, where buyers step in consistently, preventing further decline.
Strong Highs and Lows
Strong High
A strong high is a price level where the market repeatedly fails to push higher. Typically, it’s characterized by:
Rejection: Price approaches the high but then reverses sharply, often leaving long upper wicks on the candlestick chart.
Consolidation: Multiple bars might show highs that are very close in value (often termed "equal highs"), indicating a well-established resistance zone.
Market Sentiment: This pattern suggests that sellers are actively defending that level, preventing further upward movement.
Strong Lows
Conversely, a strong low is a price level where the market repeatedly fails to break lower. It is identified by:
Bounce Back: Price touches the low and then rebounds sharply, often leaving long lower wicks.
Consistency: Multiple lows occur around the same level (sometimes referred to as "equal lows"), marking a solid support area.
Market Sentiment: This indicates that buyers are stepping in at that level, absorbing selling pressure and supporting the price.
The image above shows Radi IQ detecting both a strong high and strong low, while the detected strong low acts as support when retested.
Liquidity Grabs
Liquidity grabs occur when the market temporarily moves to absorb liquidity, often triggering stop-loss orders and leading to rapid price movements. Radi IQ flags these events by identifying conditions where price moves against recent pivots, helping traders spot potential liquidity-related reversals or breakouts.
The image above shows Radi IQ identifying both an upside liquidity grab and a downside liquidity grab.
Upside Liquidity Grab (Bearish)
An upside liquidity grab happens when the price moves above a well-known resistance area or recent high. This move is often short-lived.
Many traders place stop-loss orders or pending buy orders just above resistance levels. Institutional players may intentionally push price upward to trigger these orders, thereby “grabbing” the liquidity available at that level.
Downside Liquidity Grab (Bullish)
A downside liquidity grab is the mirror image: the price briefly dips below a key support level or recent low.
Traders often place stop-loss orders or pending sell orders just below support levels. An intentional drop below this support can trigger these stops, allowing institutional players to capture liquidity.
Multi-Timeframe Analysis and Swings
By using data from different timeframes, Radi IQ offers a broader perspective on market trends. It highlights significant swing highs and swing lows, providing visual cues that indicate the market’s directional bias. This feature assists traders in identifying both short-term opportunities and long-term trends.
The image above shows Radi IQ detecting higher swings and lower swings.
IQ Meters / Fibometer
IQ Meters (Fibometers) are a proprietary TradingIQ tool that allows traders to easily identify the highs and lows of the current trend and where current price is relative to these points.
The image above depicts the IQ Meters—an exclusive TradingIQ tool designed to help traders evaluate trend strength and retracement opportunities.
When the lower timeframe Zig Zag IQ and the higher timeframe Zig Zag IQ are out of sync (i.e., one is uptrending while the other is downtrending, with no active positions), the meters display a neutral color as shown in the image.
The key to using these meters is to identify trend unison and pinpoint key trend retracement entry opportunities. Fibonacci retracement levels for the current trend are interlaced along each meter, and the current price is converted to a retracement ratio of the trend.
These meters can mathematically determine where price stands relative to the larger and smaller trends, aiding in identifying entry opportunities.
The top of each meter indicates the highest price achieved during the current price move.
The bottom of each meter indicates the lowest price achieved during the current price move.
When both the larger and smaller trends are in sync and uptrending, or when a long position is active, the IQ meters turn green, indicating uptrend strength.
When both meters are green, it indicates uptrend strength as both the higher timeframe trend and lower timeframe trend are in unison. Look for price to retrace to key fibonacci retracement levels during this time period.
When both trends are in sync and downtrending, or when a short position is active, the IQ meters turn red, indicating downtrend strength.
When both meters are red, it indicates downtrend strength as both the higher timeframe trend and lower timeframe trend are in unison. Look for price to retrace to key fibonacci retracement levels during this time period.
Summary
Radi IQ serves as a robust, data-driven tool for traders who seek a deeper understanding of market structure. By integrating internal and external analysis, fair value gap detection, order block identification, premium discount zoning, equal level tracking, liquidity grabs and much more into one indicator, it offers a multi-layered view of the market. This helps traders not only recognize potential turning points and areas of market stress but also manage risk more effectively and plan their trades with greater precision. The indicator’s clear visual representation and dynamic updates make it a practical addition to any trader’s toolkit.

Advanced ORB IndicatorAdvanced ORB (Opening Range Breakout) Indicator
Overview
The Advanced ORB Indicator is a sophisticated trading tool designed to capture high-probability breakout opportunities across multiple markets. By identifying the opening range of a trading session and detecting meaningful breakouts, this indicator helps traders enter trending moves with strong momentum while filtering out false signals.
Core Concept
The Opening Range Breakout strategy is based on the principle that the initial trading range of a session often defines key support and resistance levels. When price breaks convincingly beyond this range with proper confirmation, it frequently indicates the beginning of a directional move that can persist throughout the session.
Key Features
### Intelligent Market Detection
- Automatically identifies market type (US Stocks, Forex, Crypto, EU/Asia Stocks)
- Applies optimal default timings based on market characteristics
- Configurable time zones (Exchange, UTC, Local) for precise session timing
Customizable Session Settings
- Adjustable opening range duration (15-240 minutes)
- Flexible reset periods (Daily, Weekly, Monthly, or Never)
- Custom session start times to match specific market opens or pre-market periods
Advanced Signal Filtering
- Multi-factor confirmation system requiring strong candle bodies, proper wick ratios, and minimum breakout percentages
- Smart cooldown periods preventing clustered signals
- Retracement detection that resets signals after meaningful pullbacks
Quality Control Mechanisms
- Volume threshold filter for stronger conviction entries
- RSI-based filters to avoid overbought/oversold conditions
- Trend alignment validation using EMA and directional analysis
- Consecutive candle confirmation for higher reliability
Visual Clarity
- Clear high/low boundary visualization
- Comprehensive status panel showing current levels, trend status, and filter conditions
- Clean, non-repainting signal triangles at breakout points
Trading Applications
Stocks & ETFs
Perfect for capturing morning momentum after market open, especially effective on US equities where the first 30-60 minutes often set the tone for the day. Excellent for gap fills, trend continuations, and reversal confirmations.
Forex & Futures
Ideal for session-based strategies around London/New York opens, capturing institutional order flow as major players enter the market. Can be configured for H4/H1 longer-term breakouts in 24-hour markets.
Cryptocurrency
Powerful for identifying key breakout levels in volatile crypto markets, with adjustable parameters to filter out noise while catching significant moves. Especially effective during high-volume periods following consolidation.
Strategic Implementation
The indicator excels when used as part of a complete trading system. Consider these approaches:
1. Pure Momentum Strategy: Enter on signal, exit at fixed R:R or end of session
2. Trend Continuation: Only take signals in the direction of the higher timeframe trend
3. Support/Resistance Validation: Combine with key S/R levels for higher probability entries
4. Volume Profile Confirmation: Use in conjunction with volume profile to verify breakout significance
Optimization Tips
- Adjust Opening Range Duration based on market volatility (shorter for choppy markets, longer for trending)
- Increase filter requirements during uncertain market conditions
- Loosen filters during strong trending environments
- Use longer durations (120+ minutes) for swing trading setups
- Consider Weekly/Monthly reset periods for positional trading approaches
Performance Notes
The Advanced ORB Indicator is designed to produce fewer, higher-quality signals rather than frequent low-conviction entries. The multiple confirmation requirements mean you'll catch fewer false breakouts at the expense of occasionally later entries.
For best results, combine with proper risk management, position sizing, and an understanding of the broader market context.
*This indicator works on all timeframes but performs optimally on 1-minute to 15-minute charts for intraday trading and 1-hour to 4-hour charts for swing trading opportunities.*
// @version=5
indicator("Advanced ORB Indicator", overlay=true)
// ===================================================================
// SIGNAL REQUIREMENTS DOCUMENTATION
// ===================================================================
//
// BULL SIGNAL REQUIREMENTS:
// - ORB period must be completed (not in the opening range duration anymore)
// - Price must close above the ORB high (if waitForClose is enabled)
// - Candle must have a strong body (body to range ratio >= minBodyToRangeRatio)
// - Valid upper wick (upper wick to body ratio <= wickThreshold)
// - Bullish candle (close > open)
// - Consecutive candle confirmation (if enabled, requires multiple candles meeting criteria)
// - Volume filter (if enabled, volume > average volume * threshold)
// - RSI filter (if enabled, RSI must not be overbought)
// - EMA filter (if enabled, price must be above short EMA)
// - Trend filter (if enabled, must be in an uptrend)
// - Cooldown period satisfied (minimum bars between signals)
// - Not already signaled a bull breakout for this ORB (unless reset by retracement)
//
// BEAR SIGNAL REQUIREMENTS:
// - ORB period must be completed (not in the opening range duration anymore)
// - Price must close below the ORB low (if waitForClose is enabled)
// - Candle must have a strong body (body to range ratio >= minBodyToRangeRatio)
// - Valid lower wick (lower wick to body ratio <= wickThreshold)
// - Bearish candle (close < open)
// - Consecutive candle confirmation (if enabled, requires multiple candles meeting criteria)
// - Volume filter (if enabled, volume > average volume * threshold)
// - RSI filter (if enabled, RSI must not be oversold)
// - EMA filter (if enabled, price must be below short EMA)
// - Trend filter (if enabled, must be in a downtrend)
// - Cooldown period satisfied (minimum bars between signals)
// - Not already signaled a bear breakout for this ORB (unless reset by retracement)
//
// SIGNAL RESET CONDITIONS (for both bull and bear):
// - A significant price retracement happens (determined by retracePercent)
// - Cooldown period expires (minimum bars between signals)
// ===================================================================
// ===================================================================
// SETTINGS GUIDE - DETAILED EXPLANATION
// ===================================================================
//
// MARKET SETTINGS
// ---------------------------------------------------------------------
// Market Type: Select your market or use auto-detection
// - US Stocks: NYSE, NASDAQ, etc. (9:30 AM default open)
// - Forex: Currency pairs (uses midnight or London open)
// - Crypto: Digital currencies (uses midnight UTC)
// - EU Stocks: European exchanges (9:00 AM default)
// - Asia Stocks: Asian exchanges (9:00 AM default)
// - Custom: Manually set your preferred session time
//
// Auto-Detect Market Type: Automatically identifies the market from symbol
// - Enable for convenience when switching between different markets
// - Disable to manually set your preferred market type
//
// Use Market Default Timing: Applies optimal session start times for selected market
// - Enable to use proven default timings for the market
// - Disable to set custom session start times
//
// Time Zone: Sets the reference time zone for session calculations
// - Exchange: Uses the exchange's native time zone (recommended)
// - UTC: Uses Coordinated Universal Time
// - Local: Uses your local computer's time zone
//
// TIME SETTINGS
// ---------------------------------------------------------------------
// Session Start Hour/Minute: Sets when the opening range begins
// - Only active when "Use Market Default Timing" is disabled
// - US Stocks typically use 9:30 AM
// - For pre-market analysis, try 4:00 AM (US) or 8:00 AM (EU)
//
// Opening Range Duration: How long to measure the initial range (minutes)
// - 30-60 mins: Standard for daily ORB strategies
// - 15 mins: More responsive, good for volatile markets
// - 120 mins: More stable, fewer false signals
//
// Reset Period: When to calculate a new opening range
// - Daily: Most common, resets each trading day
// - Weekly: Weekly opening range breakout strategy
// - Monthly: Long-term support/resistance levels
// - Never: Continuous tracking without resetting
//
// SIGNAL QUALITY SETTINGS
// ---------------------------------------------------------------------
// Minimum Bars Between Signals: Prevents clustering of multiple signals
// - Higher values (8-10): Fewer signals, better quality
// - Lower values (3-5): More signals, requires more filtering
//
// Required Retracement % Before New Signal: How far price must pull back
// - Higher values (50-60%): Only signals after significant pullbacks
// - Lower values (20-30%): More signals, may include false breakouts
//
// Minimum Breakout % Required: Strength needed for valid breakout
// - Higher values (0.5-1.0%): Stronger confirmation, fewer false breakouts
// - Lower values (0.1-0.3%): More sensitive, good for low-volatility
//
// Minimum Body to Range Ratio %: Requires strong candles for signals
// - Higher values (70-80%): Only strong momentum candles trigger signals
// - Lower values (40-50%): More signals, includes weaker breakouts
//
// BREAKOUT SETTINGS
// ---------------------------------------------------------------------
// Max Wick to Body Ratio: Controls acceptable candle shape
// - Lower values (0.2-0.3): Only clean breakout candles
// - Higher values (0.5-0.6): More signals, includes wicks
//
// Use Close Price: Uses close instead of High/Low for breakouts
// - Enable for more reliable but delayed confirmation
// - Disable for earlier signals using High/Low prices
//
// Wait for Candle Close: Only signals after candle completes
// - Enable to avoid false breakouts (recommended)
// - Disable for earlier entry but higher risk
//
// FILTER SETTINGS
// ---------------------------------------------------------------------
// Filter Signals Based on Trend: Aligns signals with the overall trend
// - Enable to filter out counter-trend signals (recommended)
// - Disable for range-bound markets or counter-trend strategies
//
// Trend Detection Period: Lookback period for trend calculation
// - Longer periods (50-100): Identifies major trends
// - Shorter periods (20-30): More responsive to recent price action
//
// Trend Strength Threshold: How strong trend must be
// - Higher values (0.7-0.8): Only strong trends generate signals
// - Lower values (0.5-0.6): More signals in choppy markets
//
// Use Volume Filter: Requires above-average volume for signals
// - Enable for stocks and futures (recommended)
// - May disable for some forex pairs with unreliable volume data
//
// Volume Threshold: How much above average volume is required
// - Higher values (2.0-3.0x): Only significant volume spikes
// - Lower values (1.2-1.5x): More signals, less volume confirmation
//
// Use RSI Filter: Prevents signals in overbought/oversold conditions
// - Enable to avoid exhausted moves
// - Disable for strong trend following
//
// Use EMA Alignment Filter: Ensures price is in the right direction
// - Enable for trend confirmation (recommended)
// - Disable for early reversal signals
//
// Require Consecutive Candle Confirmation: Needs multiple confirming candles
// - Enable for higher quality signals
// - Disable for faster but riskier entries
//
// DISPLAY SETTINGS
// ---------------------------------------------------------------------
// Show Label with Values: Displays current ORB levels and status
// Show Range Boundaries: Displays high/low lines on chart
// High/Low Boundary Color: Customize appearance
//
// ===================================================================
// RECOMMENDED SETTINGS BY MARKET TYPE
// ===================================================================
//
// US STOCKS - STANDARD
// ---------------------------------------------------------------------
// - Market Type: US Stocks
// - Opening Range Duration: 30 minutes
// - Reset Period: Daily
// - Wait for Candle Close: Enabled
// - Use Volume Filter: Enabled (Volume Threshold: 1.5-2.0x)
// - Use Trend Filter: Enabled
// - Minimum Breakout %: 0.3-0.5%
//
// US STOCKS - EARNINGS/HIGH VOLATILITY
// ---------------------------------------------------------------------
// - Opening Range Duration: 60 minutes (more stable)
// - Minimum Breakout %: 0.7-1.0% (stronger moves required)
// - Minimum Bars Between Signals: 8-10 (avoid whipsaws)
// - Required Retracement %: 40-50% (deeper pullbacks)
// - Volume Threshold: 2.5-3.0x (higher volume confirmation)
//
// CRYPTO
// ---------------------------------------------------------------------
// - Market Type: Crypto
// - Opening Range Duration: 120 minutes (crypto needs longer)
// - Reset Period: Daily
// - Minimum Breakout %: 1.0-1.5% (higher volatility needs stronger breakouts)
// - Volume Threshold: 2.0-2.5x
// - Consider disabling RSI Filter (trending crypto often stays overbought/oversold)
//
// FOREX - MAJOR PAIRS
// ---------------------------------------------------------------------
// - Market Type: Forex
// - Session Start: Consider 8:00 AM (London open) or 5:00 PM (Asian open)
// - Opening Range Duration: 60-120 minutes
// - Min Body to Range Ratio: 50-60% (forex can have smaller bodies)
// - Consider disabling Volume Filter (unreliable on some platforms)
// - Trend Strength Threshold: 0.6-0.7 (forex tends to trend well)
//
// EU STOCKS
// ---------------------------------------------------------------------
// - Market Type: EU Stocks
// - Opening Range Duration: 60 minutes
// - Reset Period: Daily
// - Use EMA Alignment: Enabled
// - Use Volume Filter: Enabled
//
// SMALL CAP/VOLATILE STOCKS
// ---------------------------------------------------------------------
// - Opening Range Duration: 15-30 minutes (captures early moves)
// - Minimum Breakout %: 1.0-2.0% (needs stronger breakouts)
// - Volume Threshold: 3.0x (needs significant volume)
// - Max Wick to Body Ratio: 0.3 (cleaner breakouts)
// - Use Consecutive Candle Confirmation: Enabled (2-3 candles)
//
// LOW VOLATILITY ENVIRONMENT
// ---------------------------------------------------------------------
// - Opening Range Duration: 30-60 minutes
// - Minimum Breakout %: 0.2-0.3% (lower threshold for tight ranges)
// - Required Retracement %: 20-30% (smaller pullbacks)
// - Consider disabling Consecutive Candle Confirmation
//
// HIGH VOLATILITY ENVIRONMENT
// ---------------------------------------------------------------------
// - Opening Range Duration: 60-120 minutes (more stable)
// - Minimum Breakout %: 0.8-1.5% (stronger confirmation)
// - Required Retracement %: 50-60% (deeper pullbacks)
// - Minimum Bars Between Signals: 8-10 (avoid choppy signals)
// - Use Consecutive Candle Confirmation: Enabled (2-3 candles)
// ===================================================================

real_time_candlesIntroduction
The Real-Time Candles Library provides comprehensive tools for creating, manipulating, and visualizing custom timeframe candles in Pine Script. Unlike standard indicators that only update at bar close, this library enables real-time visualization of price action and indicators within the current bar, offering traders unprecedented insight into market dynamics as they unfold.
This library addresses a fundamental limitation in traditional technical analysis: the inability to see how indicators evolve between bar closes. By implementing sophisticated real-time data processing techniques, traders can now observe indicator movements, divergences, and trend changes as they develop, potentially identifying trading opportunities much earlier than with conventional approaches.
Key Features
The library supports two primary candle generation approaches:
Chart-Time Candles: Generate real-time OHLC data for any variable (like RSI, MACD, etc.) while maintaining synchronization with chart bars.
Custom Timeframe (CTF) Candles: Create candles with custom time intervals or tick counts completely independent of the chart's native timeframe.
Both approaches support traditional candlestick and Heikin-Ashi visualization styles, with options for moving average overlays to smooth the data.
Configuration Requirements
For optimal performance with this library:
Set max_bars_back = 5000 in your script settings
When using CTF drawing functions, set max_lines_count = 500, max_boxes_count = 500, and max_labels_count = 500
These settings ensure that you will be able to draw correctly and will avoid any runtime errors.
Usage Examples
Basic Chart-Time Candle Visualization
// Create real-time candles for RSI
float rsi = ta.rsi(close, 14)
Candle rsi_candle = candle_series(rsi, CandleType.candlestick)
// Plot the candles using Pine's built-in function
plotcandle(rsi_candle.Open, rsi_candle.High, rsi_candle.Low, rsi_candle.Close,
"RSI Candles", rsi_candle.candle_color, rsi_candle.candle_color)
Multiple Access Patterns
The library provides three ways to access candle data, accommodating different programming styles:
// 1. Array-based access for collection operations
Candle candles = candle_array(source)
// 2. Object-oriented access for single entity manipulation
Candle candle = candle_series(source)
float value = candle.source(Source.HLC3)
// 3. Tuple-based access for functional programming styles
= candle_tuple(source)
Custom Timeframe Examples
// Create 20-second candles with EMA overlay
plot_ctf_candles(
source = close,
candle_type = CandleType.candlestick,
sample_type = SampleType.Time,
number_of_seconds = 20,
timezone = -5,
tied_open = true,
ema_period = 9,
enable_ema = true
)
// Create tick-based candles (new candle every 15 ticks)
plot_ctf_tick_candles(
source = close,
candle_type = CandleType.heikin_ashi,
number_of_ticks = 15,
timezone = -5,
tied_open = true
)
Advanced Usage with Custom Visualization
// Get custom timeframe candles without automatic plotting
CandleCTF my_candles = ctf_candles_array(
source = close,
candle_type = CandleType.candlestick,
sample_type = SampleType.Time,
number_of_seconds = 30
)
// Apply custom logic to the candles
float ema_values = my_candles.ctf_ema(14)
// Draw candles and EMA using time-based coordinates
my_candles.draw_ctf_candles_time()
ema_values.draw_ctf_line_time(line_color = #FF6D00)
Library Components
Data Types
Candle: Structure representing chart-time candles with OHLC, polarity, and visualization properties
CandleCTF: Extended candle structure with additional time metadata for custom timeframes
TickData: Structure for individual price updates with time deltas
Enumerations
CandleType: Specifies visualization style (candlestick or Heikin-Ashi)
Source: Defines price components for calculations (Open, High, Low, Close, HL2, etc.)
SampleType: Sets sampling method (Time-based or Tick-based)
Core Functions
get_tick(): Captures current price as a tick data point
candle_array(): Creates an array of candles from price updates
candle_series(): Provides a single candle based on latest data
candle_tuple(): Returns OHLC values as a tuple
ctf_candles_array(): Creates custom timeframe candles without rendering
Visualization Functions
source(): Extracts specific price components from candles
candle_ctf_to_float(): Converts candle data to float arrays
ctf_ema(): Calculates exponential moving averages for candle arrays
draw_ctf_candles_time(): Renders candles using time coordinates
draw_ctf_candles_index(): Renders candles using bar index coordinates
draw_ctf_line_time(): Renders lines using time coordinates
draw_ctf_line_index(): Renders lines using bar index coordinates
Technical Implementation Notes
This library leverages Pine Script's varip variables for state management, creating a sophisticated real-time data processing system. The implementation includes:
Efficient tick capturing: Samples price at every execution, maintaining temporal tracking with time deltas
Smart state management: Uses a hybrid approach with mutable updates at index 0 and historical preservation at index 1+
Temporal synchronization: Manages two time domains (chart time and custom timeframe)
The tooltip implementation provides crucial temporal context for custom timeframe visualizations, allowing users to understand exactly when each candle formed regardless of chart timeframe.
Limitations
Custom timeframe candles cannot be backtested due to Pine Script's limitations with historical tick data
Real-time visualization is only available during live chart updates
Maximum history is constrained by Pine Script's array size limits
Applications
Indicator visualization: See how RSI, MACD, or other indicators evolve in real-time
Volume analysis: Create custom volume profiles independent of chart timeframe
Scalping strategies: Identify short-term patterns with precisely defined time windows
Volatility measurement: Track price movement characteristics within bars
Custom signal generation: Create entry/exit signals based on custom timeframe patterns
Conclusion
The Real-Time Candles Library bridges the gap between traditional technical analysis (based on discrete OHLC bars) and the continuous nature of market movement. By making indicators more responsive to real-time price action, it gives traders a significant edge in timing and decision-making, particularly in fast-moving markets where waiting for bar close could mean missing important opportunities.
Whether you're building custom indicators, researching price patterns, or developing trading strategies, this library provides the foundation for sophisticated real-time analysis in Pine Script.
Implementation Details & Advanced Guide
Core Implementation Concepts
The Real-Time Candles Library implements a sophisticated event-driven architecture within Pine Script's constraints. At its heart, the library creates what's essentially a reactive programming framework handling continuous data streams.
Tick Processing System
The foundation of the library is the get_tick() function, which captures price updates as they occur:
export get_tick(series float source = close, series float na_replace = na)=>
varip float price = na
varip int series_index = -1
varip int old_time = 0
varip int new_time = na
varip float time_delta = 0
// ...
This function:
Samples the current price
Calculates time elapsed since last update
Maintains a sequential index to track updates
The resulting TickData structure serves as the fundamental building block for all candle generation.
State Management Architecture
The library employs a sophisticated state management system using varip variables, which persist across executions within the same bar. This creates a hybrid programming paradigm that's different from standard Pine Script's bar-by-bar model.
For chart-time candles, the core state transition logic is:
// Real-time update of current candle
candle_data := Candle.new(Open, High, Low, Close, polarity, series_index, candle_color)
candles.set(0, candle_data)
// When a new bar starts, preserve the previous candle
if clear_state
candles.insert(1, candle_data)
price.clear()
// Reset state for new candle
Open := Close
price.push(Open)
series_index += 1
This pattern of updating index 0 in real-time while inserting completed candles at index 1 creates an elegant solution for maintaining both current state and historical data.
Custom Timeframe Implementation
The custom timeframe system manages its own time boundaries independent of chart bars:
bool clear_state = switch settings.sample_type
SampleType.Ticks => cumulative_series_idx >= settings.number_of_ticks
SampleType.Time => cumulative_time_delta >= settings.number_of_seconds
This dual-clock system synchronizes two time domains:
Pine's execution clock (bar-by-bar processing)
The custom timeframe clock (tick or time-based)
The library carefully handles temporal discontinuities, ensuring candle formation remains accurate despite irregular tick arrival or market gaps.
Advanced Usage Techniques
1. Creating Custom Indicators with Real-Time Candles
To develop indicators that process real-time data within the current bar:
// Get real-time candles for your data
Candle rsi_candles = candle_array(ta.rsi(close, 14))
// Calculate indicator values based on candle properties
float signal = ta.ema(rsi_candles.first().source(Source.Close), 9)
// Detect patterns that occur within the bar
bool divergence = close > close and rsi_candles.first().Close < rsi_candles.get(1).Close
2. Working with Custom Timeframes and Plotting
For maximum flexibility when visualizing custom timeframe data:
// Create custom timeframe candles
CandleCTF volume_candles = ctf_candles_array(
source = volume,
candle_type = CandleType.candlestick,
sample_type = SampleType.Time,
number_of_seconds = 60
)
// Convert specific candle properties to float arrays
float volume_closes = volume_candles.candle_ctf_to_float(Source.Close)
// Calculate derived values
float volume_ema = volume_candles.ctf_ema(14)
// Create custom visualization
volume_candles.draw_ctf_candles_time()
volume_ema.draw_ctf_line_time(line_color = color.orange)
3. Creating Hybrid Timeframe Analysis
One powerful application is comparing indicators across multiple timeframes:
// Standard chart timeframe RSI
float chart_rsi = ta.rsi(close, 14)
// Custom 5-second timeframe RSI
CandleCTF ctf_candles = ctf_candles_array(
source = close,
candle_type = CandleType.candlestick,
sample_type = SampleType.Time,
number_of_seconds = 5
)
float fast_rsi_array = ctf_candles.candle_ctf_to_float(Source.Close)
float fast_rsi = fast_rsi_array.first()
// Generate signals based on divergence between timeframes
bool entry_signal = chart_rsi < 30 and fast_rsi > fast_rsi_array.get(1)
Final Notes
This library represents an advanced implementation of real-time data processing within Pine Script's constraints. By creating a reactive programming framework for handling continuous data streams, it enables sophisticated analysis typically only available in dedicated trading platforms.
The design principles employed—including state management, temporal processing, and object-oriented architecture—can serve as patterns for other advanced Pine Script development beyond this specific application.
------------------------
Library "real_time_candles"
A comprehensive library for creating real-time candles with customizable timeframes and sampling methods.
Supports both chart-time and custom-time candles with options for candlestick and Heikin-Ashi visualization.
Allows for tick-based or time-based sampling with moving average overlay capabilities.
get_tick(source, na_replace)
Captures the current price as a tick data point
Parameters:
source (float) : Optional - Price source to sample (defaults to close)
na_replace (float) : Optional - Value to use when source is na
Returns: TickData structure containing price, time since last update, and sequential index
candle_array(source, candle_type, sync_start, bullish_color, bearish_color)
Creates an array of candles based on price updates
Parameters:
source (float) : Optional - Price source to sample (defaults to close)
candle_type (simple CandleType) : Optional - Type of candle chart to create (candlestick or Heikin-Ashi)
sync_start (simple bool) : Optional - Whether to synchronize with the start of a new bar
bullish_color (color) : Optional - Color for bullish candles
bearish_color (color) : Optional - Color for bearish candles
Returns: Array of Candle objects ordered with most recent at index 0
candle_series(source, candle_type, wait_for_sync, bullish_color, bearish_color)
Provides a single candle based on the latest price data
Parameters:
source (float) : Optional - Price source to sample (defaults to close)
candle_type (simple CandleType) : Optional - Type of candle chart to create (candlestick or Heikin-Ashi)
wait_for_sync (simple bool) : Optional - Whether to wait for a new bar before starting
bullish_color (color) : Optional - Color for bullish candles
bearish_color (color) : Optional - Color for bearish candles
Returns: A single Candle object representing the current state
candle_tuple(source, candle_type, wait_for_sync, bullish_color, bearish_color)
Provides candle data as a tuple of OHLC values
Parameters:
source (float) : Optional - Price source to sample (defaults to close)
candle_type (simple CandleType) : Optional - Type of candle chart to create (candlestick or Heikin-Ashi)
wait_for_sync (simple bool) : Optional - Whether to wait for a new bar before starting
bullish_color (color) : Optional - Color for bullish candles
bearish_color (color) : Optional - Color for bearish candles
Returns: Tuple representing current candle values
method source(self, source, na_replace)
Extracts a specific price component from a Candle
Namespace types: Candle
Parameters:
self (Candle)
source (series Source) : Type of price data to extract (Open, High, Low, Close, or composite values)
na_replace (float) : Optional - Value to use when source value is na
Returns: The requested price value from the candle
method source(self, source)
Extracts a specific price component from a CandleCTF
Namespace types: CandleCTF
Parameters:
self (CandleCTF)
source (simple Source) : Type of price data to extract (Open, High, Low, Close, or composite values)
Returns: The requested price value from the candle as a varip
method candle_ctf_to_float(self, source)
Converts a specific price component from each CandleCTF to a float array
Namespace types: array
Parameters:
self (array)
source (simple Source) : Optional - Type of price data to extract (defaults to Close)
Returns: Array of float values extracted from the candles, ordered with most recent at index 0
method ctf_ema(self, ema_period)
Calculates an Exponential Moving Average for a CandleCTF array
Namespace types: array
Parameters:
self (array)
ema_period (simple float) : Period for the EMA calculation
Returns: Array of float values representing the EMA of the candle data, ordered with most recent at index 0
method draw_ctf_candles_time(self, sample_type, number_of_ticks, number_of_seconds, timezone)
Renders custom timeframe candles using bar time coordinates
Namespace types: array
Parameters:
self (array)
sample_type (simple SampleType) : Optional - Method for sampling data (Time or Ticks), used for tooltips
number_of_ticks (simple int) : Optional - Number of ticks per candle (used when sample_type is Ticks), used for tooltips
number_of_seconds (simple float) : Optional - Time duration per candle in seconds (used when sample_type is Time), used for tooltips
timezone (simple int) : Optional - Timezone offset from UTC (-12 to +12), used for tooltips
Returns: void - Renders candles on the chart using time-based x-coordinates
method draw_ctf_candles_index(self, sample_type, number_of_ticks, number_of_seconds, timezone)
Renders custom timeframe candles using bar index coordinates
Namespace types: array
Parameters:
self (array)
sample_type (simple SampleType) : Optional - Method for sampling data (Time or Ticks), used for tooltips
number_of_ticks (simple int) : Optional - Number of ticks per candle (used when sample_type is Ticks), used for tooltips
number_of_seconds (simple float) : Optional - Time duration per candle in seconds (used when sample_type is Time), used for tooltips
timezone (simple int) : Optional - Timezone offset from UTC (-12 to +12), used for tooltips
Returns: void - Renders candles on the chart using index-based x-coordinates
method draw_ctf_line_time(self, source, line_size, line_color)
Renders a line representing a price component from the candles using time coordinates
Namespace types: array
Parameters:
self (array)
source (simple Source) : Optional - Type of price data to extract (defaults to Close)
line_size (simple int) : Optional - Width of the line
line_color (simple color) : Optional - Color of the line
Returns: void - Renders a connected line on the chart using time-based x-coordinates
method draw_ctf_line_time(self, line_size, line_color)
Renders a line from a varip float array using time coordinates
Namespace types: array
Parameters:
self (array)
line_size (simple int) : Optional - Width of the line, defaults to 2
line_color (simple color) : Optional - Color of the line
Returns: void - Renders a connected line on the chart using time-based x-coordinates
method draw_ctf_line_index(self, source, line_size, line_color)
Renders a line representing a price component from the candles using index coordinates
Namespace types: array
Parameters:
self (array)
source (simple Source) : Optional - Type of price data to extract (defaults to Close)
line_size (simple int) : Optional - Width of the line
line_color (simple color) : Optional - Color of the line
Returns: void - Renders a connected line on the chart using index-based x-coordinates
method draw_ctf_line_index(self, line_size, line_color)
Renders a line from a varip float array using index coordinates
Namespace types: array
Parameters:
self (array)
line_size (simple int) : Optional - Width of the line, defaults to 2
line_color (simple color) : Optional - Color of the line
Returns: void - Renders a connected line on the chart using index-based x-coordinates
plot_ctf_tick_candles(source, candle_type, number_of_ticks, timezone, tied_open, ema_period, bullish_color, bearish_color, line_width, ema_color, use_time_indexing)
Plots tick-based candles with moving average
Parameters:
source (float) : Input price source to sample
candle_type (simple CandleType) : Type of candle chart to display
number_of_ticks (simple int) : Number of ticks per candle
timezone (simple int) : Timezone offset from UTC (-12 to +12)
tied_open (simple bool) : Whether to tie open price to close of previous candle
ema_period (simple float) : Period for the exponential moving average
bullish_color (color) : Optional - Color for bullish candles
bearish_color (color) : Optional - Color for bearish candles
line_width (simple int) : Optional - Width of the moving average line, defaults to 2
ema_color (color) : Optional - Color of the moving average line
use_time_indexing (simple bool) : Optional - When true the function will plot with xloc.time, when false it will plot using xloc.bar_index
Returns: void - Creates visual candle chart with EMA overlay
plot_ctf_tick_candles(source, candle_type, number_of_ticks, timezone, tied_open, bullish_color, bearish_color, use_time_indexing)
Plots tick-based candles without moving average
Parameters:
source (float) : Input price source to sample
candle_type (simple CandleType) : Type of candle chart to display
number_of_ticks (simple int) : Number of ticks per candle
timezone (simple int) : Timezone offset from UTC (-12 to +12)
tied_open (simple bool) : Whether to tie open price to close of previous candle
bullish_color (color) : Optional - Color for bullish candles
bearish_color (color) : Optional - Color for bearish candles
use_time_indexing (simple bool) : Optional - When true the function will plot with xloc.time, when false it will plot using xloc.bar_index
Returns: void - Creates visual candle chart without moving average
plot_ctf_time_candles(source, candle_type, number_of_seconds, timezone, tied_open, ema_period, bullish_color, bearish_color, line_width, ema_color, use_time_indexing)
Plots time-based candles with moving average
Parameters:
source (float) : Input price source to sample
candle_type (simple CandleType) : Type of candle chart to display
number_of_seconds (simple float) : Time duration per candle in seconds
timezone (simple int) : Timezone offset from UTC (-12 to +12)
tied_open (simple bool) : Whether to tie open price to close of previous candle
ema_period (simple float) : Period for the exponential moving average
bullish_color (color) : Optional - Color for bullish candles
bearish_color (color) : Optional - Color for bearish candles
line_width (simple int) : Optional - Width of the moving average line, defaults to 2
ema_color (color) : Optional - Color of the moving average line
use_time_indexing (simple bool) : Optional - When true the function will plot with xloc.time, when false it will plot using xloc.bar_index
Returns: void - Creates visual candle chart with EMA overlay
plot_ctf_time_candles(source, candle_type, number_of_seconds, timezone, tied_open, bullish_color, bearish_color, use_time_indexing)
Plots time-based candles without moving average
Parameters:
source (float) : Input price source to sample
candle_type (simple CandleType) : Type of candle chart to display
number_of_seconds (simple float) : Time duration per candle in seconds
timezone (simple int) : Timezone offset from UTC (-12 to +12)
tied_open (simple bool) : Whether to tie open price to close of previous candle
bullish_color (color) : Optional - Color for bullish candles
bearish_color (color) : Optional - Color for bearish candles
use_time_indexing (simple bool) : Optional - When true the function will plot with xloc.time, when false it will plot using xloc.bar_index
Returns: void - Creates visual candle chart without moving average
plot_ctf_candles(source, candle_type, sample_type, number_of_ticks, number_of_seconds, timezone, tied_open, ema_period, bullish_color, bearish_color, enable_ema, line_width, ema_color, use_time_indexing)
Unified function for plotting candles with comprehensive options
Parameters:
source (float) : Input price source to sample
candle_type (simple CandleType) : Optional - Type of candle chart to display
sample_type (simple SampleType) : Optional - Method for sampling data (Time or Ticks)
number_of_ticks (simple int) : Optional - Number of ticks per candle (used when sample_type is Ticks)
number_of_seconds (simple float) : Optional - Time duration per candle in seconds (used when sample_type is Time)
timezone (simple int) : Optional - Timezone offset from UTC (-12 to +12)
tied_open (simple bool) : Optional - Whether to tie open price to close of previous candle
ema_period (simple float) : Optional - Period for the exponential moving average
bullish_color (color) : Optional - Color for bullish candles
bearish_color (color) : Optional - Color for bearish candles
enable_ema (bool) : Optional - Whether to display the EMA overlay
line_width (simple int) : Optional - Width of the moving average line, defaults to 2
ema_color (color) : Optional - Color of the moving average line
use_time_indexing (simple bool) : Optional - When true the function will plot with xloc.time, when false it will plot using xloc.bar_index
Returns: void - Creates visual candle chart with optional EMA overlay
ctf_candles_array(source, candle_type, sample_type, number_of_ticks, number_of_seconds, tied_open, bullish_color, bearish_color)
Creates an array of custom timeframe candles without rendering them
Parameters:
source (float) : Input price source to sample
candle_type (simple CandleType) : Type of candle chart to create (candlestick or Heikin-Ashi)
sample_type (simple SampleType) : Method for sampling data (Time or Ticks)
number_of_ticks (simple int) : Optional - Number of ticks per candle (used when sample_type is Ticks)
number_of_seconds (simple float) : Optional - Time duration per candle in seconds (used when sample_type is Time)
tied_open (simple bool) : Optional - Whether to tie open price to close of previous candle
bullish_color (color) : Optional - Color for bullish candles
bearish_color (color) : Optional - Color for bearish candles
Returns: Array of CandleCTF objects ordered with most recent at index 0
Candle
Structure representing a complete candle with price data and display properties
Fields:
Open (series float) : Opening price of the candle
High (series float) : Highest price of the candle
Low (series float) : Lowest price of the candle
Close (series float) : Closing price of the candle
polarity (series bool) : Boolean indicating if candle is bullish (true) or bearish (false)
series_index (series int) : Sequential index identifying the candle in the series
candle_color (series color) : Color to use when rendering the candle
ready (series bool) : Boolean indicating if candle data is valid and ready for use
TickData
Structure for storing individual price updates
Fields:
price (series float) : The price value at this tick
time_delta (series float) : Time elapsed since the previous tick in milliseconds
series_index (series int) : Sequential index identifying this tick
CandleCTF
Structure representing a custom timeframe candle with additional time metadata
Fields:
Open (series float) : Opening price of the candle
High (series float) : Highest price of the candle
Low (series float) : Lowest price of the candle
Close (series float) : Closing price of the candle
polarity (series bool) : Boolean indicating if candle is bullish (true) or bearish (false)
series_index (series int) : Sequential index identifying the candle in the series
open_time (series int) : Timestamp marking when the candle was opened (in Unix time)
time_delta (series float) : Duration of the candle in milliseconds
candle_color (series color) : Color to use when rendering the candle

Liquidity Sweep Filter [AlgoAlpha]Unlock a deeper understanding of market liquidity with the Liquidity Sweep Filter by AlgoAlpha. This indicator identifies liquidity sweeps, highlighting key price levels where large liquidations have occurred. By visualizing major and minor liquidation events, traders can better anticipate potential reversals and market structure shifts, making this an essential tool for those trading in volatile conditions.
Key Features :
🔍 Liquidity Sweep Detection – Identifies and highlights areas where liquidity has been swept, distinguishing between major and minor liquidation events.
📊 Volume Profile Integration – Displays a volume profile overlay, helping traders spot high-activity price zones where the market is likely to react.
📈 Trend-Based Filtering – Utilizes an adaptive trend detection algorithm to refine liquidity sweeps based on market direction, reducing noise.
🎨 Customizable Visualization – Modify colors, thresholds, and display settings to tailor the indicator to your trading style.
🔔 Alerts for Liquidity Sweeps & Trend Changes – Stay ahead of the market by receiving alerts when significant liquidity events or trend shifts occur.
How to Use:
🛠 Add the Indicator : Add the Liquidity Sweep Filter to your chart and configure the settings based on your preferred sensitivity. Adjust the major sweep threshold to filter out smaller moves.
📊 Analyze Liquidity Zones and trend direction : Look for liquidation levels where large buy or sell stops have been triggered. Major sweeps indicate strong reactions, while minor sweeps show gradual liquidity absorption. You can also see which levels are high in liquidity by the transparency of the levels.
🔔 Set-Up Alerts : Use the in-built alerts so you don't miss a trading opportunity
How It Works :
The Liquidity Sweep Filter detects liquidity events by tracking swing highs and lows (defined as a pivot where neighboring candles are lower/higher than it) where traders are likely to have placed stop-loss orders. It evaluates volume and price action, marking areas where liquidity has been absorbed by the market. Additionally, the integrated trend filter ensures that only relevant liquidity sweeps are highlighted based on market direction, lows in an uptrend and highs in a downtrend. The trend filter works by calculating a basis, and defining trend shifts when the closing price crosses over the upper or lower bands.The included volume profile further enhances analysis by displaying key trading zones where price may react.

PRINT_TYPELibrary "PRINT_TYPE"
Inputs
Inputs objects
Fields:
inbalance_percent (series int) : percentage coefficient to determine the Imbalance of price levels
stacked_input (series int) : minimum number of consecutive Imbalance levels required to draw extended lines
show_summary_footprint (series bool)
procent_volume_area (series int) : definition size Value area
new_imbalance_cond (series bool) : bool input for setup alert on new imbalance buy and sell
new_imbalance_line_cond (series bool) : bool input for setup alert on new imbalance line buy and sell
stop_past_imbalance_line_cond (series bool) : bool input for setup alert on stop past imbalance line buy and sell
Constants
Constants all Constants objects
Fields:
imbalance_high_char (series string) : char for printing buy imbalance
imbalance_low_char (series string) : char for printing sell imbalance
color_title_sell (series color) : color for footprint sell
color_title_buy (series color) : color for footprint buy
color_line_sell (series color) : color for sell line
color_line_buy (series color) : color for buy line
color_title_none (series color) : color None
Calculation_data
Calculation_data data for calculating
Fields:
detail_open (array) : array open from calculation timeframe
detail_high (array) : array high from calculation timeframe
detail_low (array) : array low from calculation timeframe
detail_close (array) : array close from calculation timeframe
detail_vol (array) : array volume from calculation timeframe
previos_detail_close (array) : array close from calculation timeframe
isBuyVolume (series bool) : attribute previosly bar buy or sell
Footprint_row
Footprint_row objects one footprint row
Fields:
price (series float) : row price
buy_vol (series float) : buy volume
sell_vol (series float) : sell volume
imbalance_buy (series bool) : attribute buy inbalance
imbalance_sell (series bool) : attribute sell imbalance
buy_vol_box (series box) : for ptinting buy volume
sell_vol_box (series box) : for printing sell volume
buy_vp_box (series box) : for ptinting volume profile buy
sell_vp_box (series box) : for ptinting volume profile sell
row_line (series label) : for ptinting row price
empty (series bool) : = true attribute row with zero volume buy and zero volume sell
Imbalance_line_var_object
Imbalance_line_var_object var objects printing and calculation imbalance line
Fields:
cum_buy_line (array) : line array for saving all history buy imbalance line
cum_sell_line (array) : line array for saving all history sell imbalance line
Imbalance_line
Imbalance_line objects printing and calculation imbalance line
Fields:
buy_price_line (array) : float array for saving buy imbalance price level
sell_price_line (array) : float array for saving sell imbalance price level
var_imba_line (Imbalance_line_var_object) : var objects this type
Footprint_bar
Footprint_bar all objects one bar with footprint
Fields:
foot_rows (array) : objects one row footprint
imba_line (Imbalance_line) : objects imbalance line
row_size (series float) : size rows
total_vol (series float) : total volume one footprint bar
foot_buy_vol (series float) : buy volume one footprint bar
foot_sell_vol (series float) : sell volume one footprint bar
foot_max_price_vol (map) : map with one value - price row with max volume buy + sell
calc_data (Calculation_data) : objects with detail data from calculation resolution
Support_objects
Support_objects support object for footprint calculation
Fields:
consts (Constants) : all consts objects
inp (Inputs) : all input objects
bar_index_show_condition (series bool) : calculation bool value for show all objects footprint
row_line_color (series color) : calculation value - color for row price
dop_info (series string)
show_table_cond (series bool)
footprint_typeLibrary "footprint_type"
Contains all types for calculating and rendering footprints
Inputs
Inputs objects
Fields:
inbalance_percent (series int) : percentage coefficient to determine the Imbalance of price levels
stacked_input (series int) : minimum number of consecutive Imbalance levels required to draw extended lines
show_summary_footprint (series bool) : bool input for show summary footprint
procent_volume_area (series int) : definition size Value area
show_vah (series bool) : bool input for show VAH
show_poc (series bool) : bool input for show POC
show_val (series bool) : bool input for show VAL
color_vah (series color) : color VAH line
color_poc (series color) : color POC line
color_val (series color) : color VAL line
show_volume_profile (series bool)
new_imbalance_cond (series bool) : bool input for setup alert on new imbalance buy and sell
new_imbalance_line_cond (series bool) : bool input for setup alert on new imbalance line buy and sell
stop_past_imbalance_line_cond (series bool) : bool input for setup alert on stop past imbalance line buy and sell
Constants
Constants all Constants objects
Fields:
imbalance_high_char (series string) : char for printing buy imbalance
imbalance_low_char (series string) : char for printing sell imbalance
color_title_sell (series color) : color for footprint sell
color_title_buy (series color) : color for footprint buy
color_line_sell (series color) : color for sell line
color_line_buy (series color) : color for buy line
color_title_none (series color) : color None
Calculation_data
Calculation_data data for calculating
Fields:
detail_open (array) : array open from calculation timeframe
detail_high (array) : array high from calculation timeframe
detail_low (array) : array low from calculation timeframe
detail_close (array) : array close from calculation timeframe
detail_vol (array) : array volume from calculation timeframe
previos_detail_close (array) : array close from calculation timeframe
isBuyVolume (series bool) : attribute previosly bar buy or sell
Footprint_row
Footprint_row objects one footprint row
Fields:
price (series float) : row price
buy_vol (series float) : buy volume
sell_vol (series float) : sell volume
imbalance_buy (series bool) : attribute buy inbalance
imbalance_sell (series bool) : attribute sell imbalance
buy_vol_box (series box) : for ptinting buy volume
sell_vol_box (series box) : for printing sell volume
buy_vp_box (series box) : for ptinting volume profile buy
sell_vp_box (series box) : for ptinting volume profile sell
row_line (series label) : for ptinting row price
empty (series bool) : = true attribute row with zero volume buy and zero volume sell
Value_area
Value_area objects for calculating and printing Value area
Fields:
vah_price (series float) : VAH price
poc_price (series float) : POC price
val_price (series float) : VAL price
vah_label (series label) : label for VAH
poc_label (series label) : label for POC
val_label (series label) : label for VAL
vah_line (series line) : line for VAH
poc_level (series line) : line for POC
val_line (series line) : line for VAL
Imbalance_line_var_object
Imbalance_line_var_object var objects printing and calculation imbalance line
Fields:
cum_buy_line (array) : line array for saving all history buy imbalance line
cum_sell_line (array) : line array for saving all history sell imbalance line
Imbalance_line
Imbalance_line objects printing and calculation imbalance line
Fields:
buy_price_line (array) : float array for saving buy imbalance price level
sell_price_line (array) : float array for saving sell imbalance price level
var_imba_line (Imbalance_line_var_object) : var objects this type
Footprint_info_var_object
Footprint_info_var_object var objects for info printing
Fields:
cum_delta (series float) : var delta volume
cum_total (series float) : var total volume
cum_buy_vol (series float) : var buy volume
cum_sell_vol (series float) : var sell volume
cum_info (series table) : table for ptinting
Footprint_info
Footprint_info objects for info printing
Fields:
var_info (Footprint_info_var_object) : var objects this type
total (series label) : total volume
delta (series label) : delta volume
summary_label (series label) : label for ptinting
Footprint_bar
Footprint_bar all objects one bar with footprint
Fields:
foot_rows (array) : objects one row footprint
val_area (Value_area) : objects Value area
imba_line (Imbalance_line) : objects imbalance line
info (Footprint_info) : objects info - table,label and their variable
row_size (series float) : size rows
total_vol (series float) : total volume one footprint bar
foot_buy_vol (series float) : buy volume one footprint bar
foot_sell_vol (series float) : sell volume one footprint bar
foot_max_price_vol (map) : map with one value - price row with max volume buy + sell
calc_data (Calculation_data) : objects with detail data from calculation resolution
Support_objects
Support_objects support object for footprint calculation
Fields:
consts (Constants) : all consts objects
inp (Inputs) : all input objects
bar_index_show_condition (series bool) : calculation bool value for show all objects footprint
row_line_color (series color) : calculation value - color for row price

Liquidity composition / quantifytools- Overview
Liquidity composition divides each candle into sections that are used to display transaction activity at price. In simple terms, an X-ray through candle is formed, revealing the orderflow that built the candle in greater detail. Liquidity composition consists of two main components, lots and columns. Lots and columns can be used to visualize user specified volume types, currently supporting net volume and volume delta. Lots and columns can be used to visualize same or different volume types, allowing a combination of volume footprint, volume delta footprint and volume profile in one single view. Liquidity composition principally works on any chart, whether that is equities, currencies, cryptocurrencies or commodities, even charts with no volume data (in which case volatility is used to approximate transaction activity). The script also works on any timeframe, from minute charts to monthly charts. Orderflow can be observed in real-time as it develops and none of the indications are repainted.
Example: Displaying same volume types on lots and columns
Example: Displaying different volume types on lots and columns
Liquidity composition supports user specified derivative data, such as point of control(s) and net activity coloring. Derivative data can be calculated based on either net volume or volume delta, resulting in different highlights.
With net volume, volume delta and derivative data in one view, key orderflow events such as delta imbalances, high volume nodes, low volume nodes and point of controls can be used to quickly identify accumulation/distribution, imbalances, unfinished/finished auctions and trapped traders.
Accessing script 🔑
See "Author's instructions" section, found at bottom of the script page.
Key takeaways
- Liquidity composition breaks down transaction activity at price, measured in net volume or volume delta
- Developing activity can be observed real-time, none of the indications are repainted
- Transaction activity is calculated using volumes accrued in lower timeframe price movements
- Lots and columns can be used to display same or different volume types (e.g. volume delta lots and net volume columns) in single view
- Users can specify derivative data such as volume delta POCs, net volume POC and net activity coloring
- For practical guide with practical examples, see last section
Disclaimer
Orderflow data is estimated using lower timeframe price movement. While accurate and useful, it's important to note the calculations are estimations and are not based on orderbook data. Estimates are calculated by allotting volume developing on lower timeframe chart to its respective section based on closing price. Volume delta (difference between buyers/sellers) is calculated by subtracting down move volumes (sell volume) from up move volumes (buy volume). Accuracy of the orderflow estimations largely depends on quality of lower timeframe chart used for calculations, which is why this tool cannot be expected to work accurately on illiquid charts with broken data.
Liquidity composition does not provide a standalone trading strategy or financial advice. It also does not substitute knowing how to trade. Example charts and ideas shown for use cases are textbook examples under ideal conditions, not guaranteed to repeat as they are presented. Liquidity composition should be viewed as one tool providing one kind of evidence, to be used in conjunction with other means of analysis.
- Example charts
Chart #1: BTCUSDT
Chart #2: EURUSD
Chart #3: ES futures
- Calculations
By default, size of sections and lower timeframe accuracy are automatically determined for all charts and timeframes. Number of lower timeframe price moves used for calculating orderflow is kept at fixed value, by default set to 350. Accuracy value dictates how many lower timeframe candles are included in the calculation of volume at price. At 350, the script will always use 350 lower timeframe price movements in calculations (when possible). When calculated dynamic timeframe is less than 1 minute, the script switches to available seconds based timeframes. Minimum dynamic timeframe can be capped to 1 minute (as seconds based timeframes are not available for all plans) or dynamic timeframe can be overridden using an user specified timeframe.
Example: Calculating dynamic lower timeframe
Main chart: 4H / 240 minutes
Accuracy value: 100
Formula: 240 minutes / 100 = 2.4 minutes
Timeframe used for calculations = 2 minutes
Section size is automatically determined based on typical historical candle range, the bigger it is, the bigger the section size as well. Like dynamic timeframe, automatic section size can be manually overridden by user specified size expressed in ticks (minimum price unit). Users can also adjust sensitivity of automatic sizing by setting it higher (smaller sections, more detail and more noise) or lower (less sections, less detail and less noise). Section size and dynamic timeframe can be monitored via metric table.
Volume at price is calculated by allotting volume associated with a lower timeframe price movement to its respective section based on closing price (volume is stored to the section that covers closing price). When used on a chart with no volume data, volatility is used instead to determine likely magnitude of participation. Volume delta (difference between buyers/sellers) is calculated by subtracting down move volumes (sell volume) from up move volumes (buy volume). Volumes accrued in sections are monitored over a longer period of time to determine a "normal" amount of activity, which is then used to normalize accrued volumes by benchmarking them against historical values.
Volume values displayed on the left side represent how close or far volume traded at given section is to an extreme, represented by value of 10 . The more value exceeds 10, the more extreme transaction activity is historically. The lesser the value, the less extreme (and therefore more typical) transaction activity is. Users can adjust sensitivity of volume extreme threshold, either by increasing it (more transaction activity is needed to constitute an extreme) or decreasing it (less transaction activity is needed to constitute an extreme).
Example: Interpreting volume scale
0 = Very little to no transaction activity compared to historical values
5 = Transaction activity equal to average historical values
10 = Transaction activity equal to an extreme in historical values
10+ = The more transaction activity exceeds value of 10, the more extreme it is historically
Accuracy of orderflow data largely depends on quality of lower timeframe data used in calculations. Sometimes quality of underlying lower timeframe data is insufficient due to suboptimal accuracy or broken lower timeframe data, usually caused by illiquid charts with gaps and inconsistent values. Therefore, one should always ensure the usage of most liquid chart available with no gaps in lower timeframe data. To combat poor orderflow data, a simple data quality check is conducted by calculating percentage of sections with volume data out of all available sections. Idea behind the test is to capture instances where unusual amount of sections are completely empty, most likely due to data gaps in LTF chart. E.g. 90% of sections hold some volume data, 10% are completely empty = 90% data quality score.
Data quality score should be viewed as a metric alerting when detail of underlying data is insufficient to consider accurate. When data quality score is slightly below threshold, lower timeframe chart used for calculations is likely fine, but accuracy value is too low. In this case, one should increase accuracy value or manually override used timeframe with a smaller one. When data quality score is well below threshold, lower timeframe chart used for calculations is likely broken and cannot be fixed. In this case, one should look for alternative charts with more reliable data (e.g. ES1! -> SPY, BITSTAMP:BTCUSD -> BINANCE:BTCUSDT).
Example : When insufficient data quality scores can/cannot be fixed
- Derivative data
Point of control
Point of control, referring to point in price where transaction activity is highest, can be calculated based on the volume type of lots or columns (based on net volume or volume delta). Depending on the calculation basis, displayed point of controls will vary. POC calculated based on net volume is no different from traditional POC, it is simply the section with highest amount of transaction activity, marked with an X. When calculating POC based on volume delta, the script will highlight two point of controls, named leading and losing point of control . Leading POC refers to lot with highest amount of volume delta, marked with an X. If leading POC was net buy volume, losing POC is marked on section with highest net sell volume, marked with S respectfully. Same logic applies in vice versa, if leading POC is net sell volume, losing POC is marked on highest buy volume section, using the letter B.
Net activity
Similarly to point of control calculation, net activity can be calculated based on either volume types, lots or columns. When calculating net activity based on net volume, candles will be colorized according to magnitude of total volume traded. When calculating net activity based on volume delta, candles will be colorized according to side with most volume traded (buyers or sellers). Net activity color can be applied on borders or body of a candle.
- Visuals
Lots, columns, candles and POCs can be colorized using a fixed color or a volume based dynamic color, with separate color options for buy side volume, sell side volume and net volume.
Metric table can be offsetted horizontally or vertically from any four corners of the chart, allowing space for tables from other scripts.
Table sizes, label sizes and offsets for visuals are fully customizable using settings menu.
- Practical guide
OHLC data (candles) is a simple condensed visualization of an auction market process. Candles show where price was in the beginning of an auction period (timeframe), the highest/lowest point and where price was at the end of an auction. The core utility of Liquidity composition is being able to view the same auction market process in much greater detail, revealing likely intention, effort and magnitude driving the process. All basic orderflow concepts, such as ones presented by auction market theory can be applied to Liquidity composition as well.
The most obvious and easy to spot use case for orderflow tools is identifying trapped traders/absorption, seen in high transaction activity at the very highs/lows of a candle or even better, at wicks. High participation at wicks can be used to identify forced orders absorbed into limit orders, idea behind being that when high transaction activity is placed at a wick, price went one direction with a lot of participation (high effort) and came right back up (low impact) within the same time period.
Absorption can show itself in many ways:
- Extreme buy volume sections at wick highs or buy side POC at wick highs
- Multiple, clustered high buy volume sections (but not extreme) at wick highs
- Positive net volume delta into a reversal down
- Extreme sell volume sections at wick lows or sell side POC at wick lows
- Multiple, clustered high sell volume sections (but not extreme) at wick lows
- Negative net volume delta into a reversal up
- Extreme net volume sections at or net volume POC at wick highs/lows
- Extreme net volume into a reversal up/down
For accurate analysis, orderflow based events should be viewed in the context of price action. To identify absorption, it's best to look for opportunities where an opposing trend is clearly in place, e.g. absorption into highs on an uptrend, absorption into lows on a downtrend. When price is ranging without a clear trend or there's no opposing trend, extreme activity at an extreme end of a candle might be aggressive participants attempting to initiate a new trend, rather than getting absorbed in the same sense. With enough effort put into pushing price to the opposite direction at overextended price, a shift in trend direction might be near.
Price action based levels are a great way to get context around orderflow events. Simple range highs/lows as a single data point serve as a high probability regimes for reversals, making them a great point of confluence for identifying trapped traders.
Low to zero volume sections can be used to identify points in price with little to no trading, leaving a volume null/void behind. Typically sections like these represent gaps on a lower timeframe chart, which can be used as reference levels for targets and support/resistance.
Net volume can be used for same purposes as above, but for determining general intention of market participants it's a much more suitable tool than volume delta. According to auction market theory, low/no participation is considered to reject prices and high participation is considered to accept prices. With this concept in mind, unfinished auctions occur when participation is high at highs or high at lows, idea behind being that participants are showing willingness and interest to trade at higher or lower prices. Auction is considered finished when the opposite is true, i.e. when participants are not showing willingness to trade at higher/lower prices. In general, direction of unfinished auctions can be expected to continue shortly and direction of unfinished auctions can be expected to hold.
While shape of volume delta and net volume are usually similar, they're not the same thing and do not represent the same event under the hood. Volume delta at 0 does not necessarily mean participation is 0, but can also mean high participation with equal amount of buying and selling. With this distinction in mind, using volume delta and net volume in tandem has the benefit of being able to identify points in price with a lot of up and down price movement packed into a small area, i.e. consolidation. Points in price where price hangs around for an extended period of time can be used to identify levels of interest for re-tests and breakout opportunities.

Tick Profile HeatmapThis is a market internal TICK heatmap with the intent of displaying areas of price associated to stronger reactions with NYSE TICK (by default).
This code is based off of a variation of a Volume Profile coded originally by colejustice who originally used code from LuxAlgo . The full-width volume bars that colejustice setup were replaced with full-width bars representative of TICK breaking +/- $500, the current cumulative value representing the "heat" is comprised of hlc3 by default but that can be changed. In a future update I may add additional logic here to capture highs and lows in the heatmap specifically, and perhaps additional colors.
As with other traditional profiling studies, this indicators purpose is to visualize correspondence to specific price levels, allowing rapid assessment where the most TICK activity is occurring, and where it hasn't been. This information may provide areas of support and resistance and regions where price may move quickly repeatedly.
All of the same input guidance that colejustice provided is the same for those pre-existing inputs:
Inputs are set up such that you can customize the lookback period, number of rows, and width of rows for most major timeframes individually. Timeframes between those available will use the next lower timeframe settings (e.g., 2m chart will use the 1m settings.)
Zero usage of volume is present in this indicator, only TICK data so please don't confuse it with volume studies.

VPLineVPLine is a brand-new line indicator which automatically draws historical POC line with volume profile histograms based on user input session and configurations.
A colossal amount of function is deployed on the indicator: historical POC line, historical VA, historical VA high/low, volume profile histograms, volume profile value text (bid/ask/total), threshold function that limits the extension of the POC line based on user input etc.
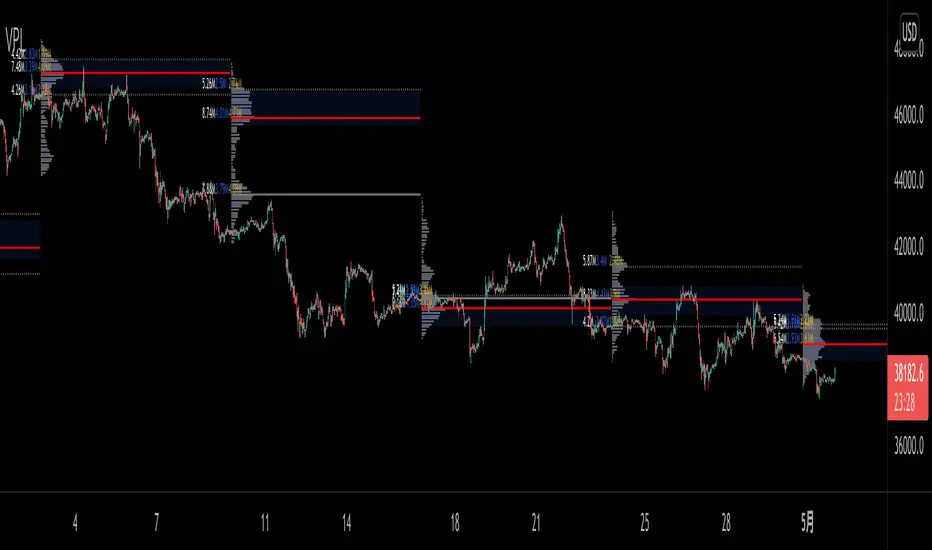
Volume CompressorTurns volume into a more informative representation, ready to be further analyzed
...
Rationale
Volume
Back in the "before the quant" days I was a big fan of market & volume profile. Thing is J. Steidlmayer had lotta different ideas & works aside of profiling, it's just most of them ain't got to mainstream, one of them was "Hot / Cold volume" (yes, you can't really google it). From my interpretation, the idea was that in a given asset there is a usual constant volume that stays there no matter what, and if it ever changes it changes very slow and gradually; and there's another kind of, so to say, 'active' volume that actually influences price dynamics and very volatile by its nature. So I've met concept lately, and decided to quantify & model it one day when I'll have an idea how. That day was yesterday.
Compression
When we do music we always use different kinds of filters (low-pass, high pass, etc) for equalization and filtering itself. That stuff we use in finance as well. What we also always use in music are compressors, there dynamic processors that automatically adjust volume so it will be more consistent. Almost all the cool music you hear is compressed (both individual instruments (especially vocals) and the whole track afterwards), otherwise stuff will be too quite and too weak to flex on it, and also DJing it would be a nightmare. I am a big adept of loudness war. So I was like, how can I use compression in finance, when ima get an idea? That day was yesterday as well.
Volume structure
Being inspired by Steidlmayer's idea, I decided to distinguish volume this way:
1) Passive / static volume. The ~ volume that's always there no matter what (hedges, arbitrages, spread legs, portfolio parts etc etc), doesn't affect things;
2) Active / dynamic volume. The volume that flows from one asset to another, really matters and affects things;
3) Excess volume. The last portion of number 2 volume, that doesn't represent any powerful value to affect things.
Now it's clear that we can get rid of number 1 and number 3, the components that don't really matter, and concentrate on number 2 in order to improve information gain, both for ourselves and for the models we feed this data. How?
Model
I don't wanna explain it all in statistical / DSP way for once.
First of all, I think the population of volumes is log-normally distributed, so let's take logs of volumes, now we have a ~ normally distributed data. We take linearly weighted mean, add and subtract linearly weighted standard deviation from it, these would be our thresholds, the borders between different kinds of volumes explained before.
The upper threshold is for downward compression, that will not let volume pass it higher.
The lower threshold is for upward compression, all the volumes lower than this threshold will be brought up to the threshold's level.
Then we apply multipliers to the thresholds in order to adjust em and find the sweet spots. We do it the same way as in sound engineering when we don't aim for overcompression, we adjust the thresholds until they start to touch the signal and all good.
Afterwards, we delete all the number 1 and number 3 volume, leaving us exclusively with the clear main component, ready to be processed further.
We return the volumes to dem real scale.
About the parameters, based on testing I don't recommend changing the thresholds from dem default values, first of all they make sense statistically and second they work as intended.
Window length can and should be adjusted, find your own way, or leave the default value. ML (moving location) length is up to you as well.
So yeah, you can see now we can smooth the data and make it visually appealing not only by applying a smooth filter over it.
All good TV?
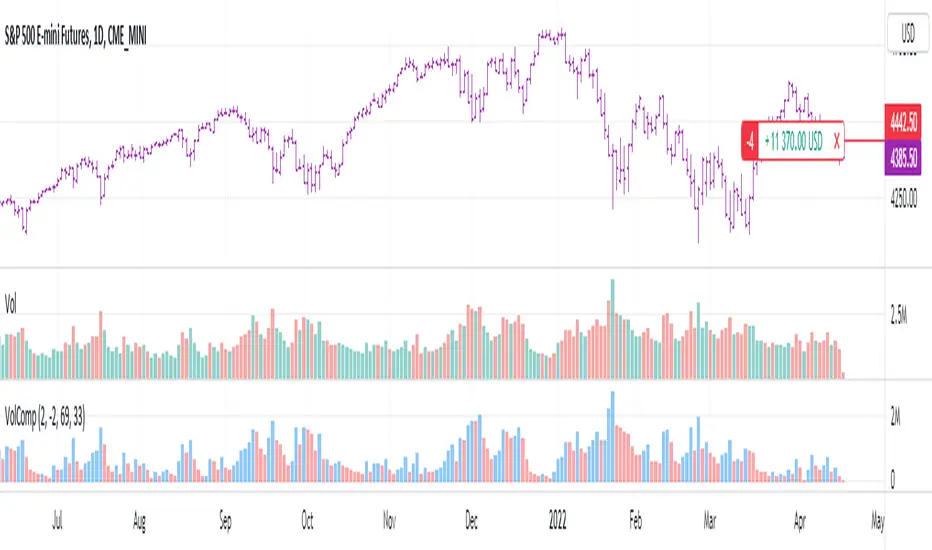
Volume+ (RVOL By Time of Day)This script is an enhanced volume indicator.
It calculates relative volume (RVOL) based on the average volume at that time of day (rather than using a moving average).
For example, using this indicator you can see today’s volume during the first 5-minute candle of the market open compared to the previous day’s volume at the market open. Or you can see today’s volume at the market close during the last 15-minute candle compared to the average of the past 20 days of volume at the market close.
Due to the different quantity of candlesticks in a session between Stocks and Forex/Crypto, I separated those markets into separate settings, making this an all-in-one volume indicator that works on all markets.
Settings:
Stocks
If you set the lookback period to 1 on the 5-minute chart and look at the 9:30am candle for a stock, then the current volume bar will show you what today’s volume is compared to yesterday’s 9:30am 5-minute candle.
If you set the lookback period to 15, then the current volume bar will show you what today’s volume is compared to the average of the last 15 days of 9:30am 5-minute candles.
Max Lookback: 64 Sessions
Stocks
This setting is for traders who want to use this indicator on a timeframe lower than the 5-minute chart.
Due to limitations in how many historical bars PineScript can reference, referencing 1-minute and 3-minute bars requires a lot more historical data so I separated the two to allow the 5-minute+ timeframes to have a longer lookback period.
Max Lookback: 12 Sessions
Forex/Crypto
When you set the script to Forex/Crypto, it does the same thing for stocks but calculates based on a 24-hour period.
So if you set the lookback period to 1 on the 1-hour chart and look at the 11:00am candle for a currency pair, then the current volume bar will show you what today’s volume is compared to yesterday’s 11:00am 1-hour candle.
If you set the lookback period to 10, then the current volume bar will show you what today’s volume is compared to the average of the last 10 days of 11:00am 1-hour candles.
Max Lookback: 17 Sessions
What Doesn’t It Work On?
Because I had to manually calculate how many volume candles to look back per timeframe to get the previous session’s candle, I had to hard-code the math in this script.
That means that this indicator will only work on 1m, 3m, 5m, 15m, 30m, 45m, 1h, 2h, 3h, 4h, Daily and Weekly timeframes. If you try to use it on any other timeframe it will revert to a regular volume indicator.
Why Is It Useful?
Similar to volume profile by price, this gives you a volume profile by time in a way that the default volume indicator does not.
For example, you can use this to determine when a stock has a particularly strong opening drive, or when a currency pair has a weak fake-out leading up to the London open, or for general confirmation on trading signals with time-specific volume information to work with.
Colors
The purple line and the faint gray bar is the RVOL value.
The blue number is the percentage of the current volume bar relative to RVOL.
There are four different bar color settings:
Heatmap – Changes color to be brighter based on higher RVOL
Price – Changes color based on price action (like the default TradingView volume indicator)
Traffic – Changes color based on RVOL percentages (for fast visual cues)
Trigger – Changes color only when the specified alert conditions are met
Heatmap:
Traffic:
Trigger:
Price:
Heatmap:
Turns very bright green at 2.0 RVOL
Turns light green at 1.0 RVOL
Turns normal green at 0.75 RVOL
Turns medium green at 0.5 RVOL
Turns very dark green at 0.25 RVOL
Is gray otherwise.
Price:
Turns red if the price action candle closed bearish.
Turns green if the price action candle closed bullish.
Traffic:
Turns red if RVOL is between 1.0 and 1.5.
Turns orange if RVOL is between 1.5 and 2.0.
Turns dark green if RVOL is between 2.0 and 3.0.
Turns bright green if RVOL is above 3.0.
Is gray otherwise.
Trigger:
Turns teal if any of the given alert conditions in the user settings are met.
Alerts
Alerts are optional. You have to set them like any other indicator, by creating a new alert and selecting this indicator.
If you leave the "Alert At RVOL %" setting at 0, then alerts will only be triggered if the current candle exceeds the 1.0 (100%) RVOL level.
If you change the "Alert At RVOL %" setting then alerts will be triggered if the RVOL percentage (blue number) exceeds your given value. The blue number is a percentage of the average, so if it’s at 0.5, then it’s 50% of the average.
Notes
- This indicator only works with regular time bars. It will not work with range, tick, renko etc.
- This script has lookback limitations due to restrictions on how many historical bars PineScript can reference. The lookback limit varies based on the market type you choose. The more bars required for calculation the lower the lookback limit.
- If you use it on the Daily timeframe the lookback period will count as 1 week. If you use it on the Weekly timeframe the lookback period will count as 1 month. So a Lookback of 3 on the Daily would be 3 weeks of averages, a Lookback of 5 on the Weekly would be 5 months of averages (for that Day of Week or Week number).
- Big thanks to @tb12345 for the idea and for helping to field-testing the indicator!

Relative Volume - VPA / VSA / Better VolumeVolume is important.
Volume is VERY important.
But all the existing methods of volume analysis and order flow analysis fall into the same trap: they're all extremely complicated, hard to learn, and difficult for the human brain to distill down to an actual, tradable signal.
The Relative Volume Gradient Paintbars indicator seeks to address this issue by reducing and simplifying concepts from Volume Price Analaysis (VPA), Volume Spread Analysis (VSA), and Market Profile / Volume Profile into a single indication with varying levels of intensity. Rather than adding more complex symbology and cluttering up your charts with arrows and signals and lines as many volume indicators do, relative volume intuitively takes advantage of the dimension of color, and plays to your brain's automatic recognition of color intensity to highlight areas of interest on a chart where large volumes are being traded. These areas can in turn point out levels of support and resistance, or show strength in a move, exposing the actions of larger market participants that are behind a move.
The Relative Volume indicator can calculate based on a time-segmented / time-based / bar-specific average of volume, adjusting for some of the typical spikes in volume that happen at the beginning and end of a trading day; Or it can be calculated based on any length and type of moving average of volume that is desired: simple, exponential, weighted, Wilders, price-weighted, Hull, or TEMA.
This indicator does more than just normal relative share volume. It can also do relative volume-per-range. The idea behind this setting is that when more volume is being traded but very little movement is happening, this can indicate substantial support or resistance, where a lot of trades are likely being absorbed by larger operators. You can choose your own range calculation for this setting, whether you prefer True Range, high-low range, candle body range, close to close range, or any of several other custom settings.
Moreover, the levels or thresholds at which the color intensity changes are completely user-controlled, so you can adjust them upward to tune out more noise, or downward to increase the level of sensitivity. In addition, all of the colors for each of the thresholds are completely user-controlled.
We hope to see TradingView add support for Richard Arms' CandleVolume or Equivolume before too long, as well as Tick Volume or Trade Count Volume data, all of which can add a lot of power to this method of trading.

Ergodic Market Divergence (EMD)Ergodic Market Divergence (EMD)
Bridging Statistical Physics and Market Dynamics Through Ensemble Analysis
The Revolutionary Concept: When Physics Meets Trading
After months of research into ergodic theory—a fundamental principle in statistical mechanics—I've developed a trading system that identifies when markets transition between predictable and unpredictable states. This indicator doesn't just follow price; it analyzes whether current market behavior will persist or revert, giving traders a scientific edge in timing entries and exits.
The Core Innovation: Ergodic Theory Applied to Markets
What Makes Markets Ergodic or Non-Ergodic?
In statistical physics, ergodicity determines whether a system's future resembles its past. Applied to trading:
Ergodic Markets (Mean-Reverting)
- Time averages equal ensemble averages
- Historical patterns repeat reliably
- Price oscillates around equilibrium
- Traditional indicators work well
Non-Ergodic Markets (Trending)
- Path dependency dominates
- History doesn't predict future
- Price creates new equilibrium levels
- Momentum strategies excel
The Mathematical Framework
The Ergodic Score combines three critical divergences:
Ergodic Score = (Price Divergence × Market Stress + Return Divergence × 1000 + Volatility Divergence × 50) / 3
Where:
Price Divergence: How far current price deviates from market consensus
Return Divergence: Momentum differential between instrument and market
Volatility Divergence: Volatility regime misalignment
Market Stress: Adaptive multiplier based on current conditions
The Ensemble Analysis Revolution
Beyond Single-Instrument Analysis
Traditional indicators analyze one chart in isolation. EMD monitors multiple correlated markets simultaneously (SPY, QQQ, IWM, DIA) to detect systemic regime changes. This ensemble approach:
Reveals Hidden Divergences: Individual stocks may diverge from market consensus before major moves
Filters False Signals: Requires broader market confirmation
Identifies Regime Shifts: Detects when entire market structure changes
Provides Context: Shows if moves are isolated or systemic
Dynamic Threshold Adaptation
Unlike fixed-threshold systems, EMD's boundaries evolve with market conditions:
Base Threshold = SMA(Ergodic Score, Lookback × 3)
Adaptive Component = StDev(Ergodic Score, Lookback × 2) × Sensitivity
Final Threshold = Smoothed(Base + Adaptive)
This creates context-aware signals that remain effective across different market environments.
The Confidence Engine: Know Your Signal Quality
Multi-Factor Confidence Scoring
Every signal receives a confidence score based on:
Signal Clarity (0-35%): How decisively the ergodic threshold is crossed
Momentum Strength (0-25%): Rate of ergodic change
Volatility Alignment (0-20%): Whether volatility supports the signal
Market Quality (0-20%): Price convergence and path dependency factors
Real-Time Confidence Updates
The Live Confidence metric continuously updates, showing:
- Current opportunity quality
- Market state clarity
- Historical performance influence
- Signal recency boost
- Visual Intelligence System
Adaptive Ergodic Field Bands
Dynamic bands that expand and contract based on market state:
Primary Color: Ergodic state (mean-reverting)
Danger Color: Non-ergodic state (trending)
Band Width: Expected price movement range
Squeeze Indicators: Volatility compression warnings
Quantum Wave Ribbons
Triple EMA system (8, 21, 55) revealing market flow:
Compressed Ribbons: Consolidation imminent
Expanding Ribbons: Directional move developing
Color Coding: Matches current ergodic state
Phase Transition Signals
Clear entry/exit markers at regime changes:
Bull Signals: Ergodic restoration (mean reversion opportunity)
Bear Signals: Ergodic break (trend following opportunity)
Confidence Labels: Percentage showing signal quality
Visual Intensity: Stronger signals = deeper colors
Professional Dashboard Suite
Main Analytics Panel (Top Right)
Market State Monitor
- Current regime (Ergodic/Non-Ergodic)
- Ergodic score with threshold
- Path dependency strength
- Quantum coherence percentage
Divergence Metrics
- Price divergence with severity
- Volatility regime classification
- Strategy mode recommendation
- Signal strength indicator
Live Intelligence
- Real-time confidence score
- Color-coded risk levels
- Dynamic strategy suggestions
Performance Tracking (Left Panel)
Signal Analytics
- Total historical signals
- Win rate with W/L breakdown
- Current streak tracking
- Closed trade counter
Regime Analysis
- Current market behavior
- Bars since last signal
- Recommended actions
- Average confidence trends
Strategy Command Center (Bottom Right)
Adaptive Recommendations
- Active strategy mode
- Primary approach (mean reversion/momentum)
- Suggested indicators ("weapons")
- Entry/exit methodology
- Risk management guidance
- Comprehensive Input Guide
Core Algorithm Parameters
Analysis Period (10-100 bars)
Scalping (10-15): Ultra-responsive, more signals, higher noise
Day Trading (20-30): Balanced sensitivity and stability
Swing Trading (40-100): Smooth signals, major moves only Default: 20 - optimal for most timeframes
Divergence Threshold (0.5-5.0)
Hair Trigger (0.5-1.0): Catches every wiggle, many false signals
Balanced (1.5-2.5): Good signal-to-noise ratio
Conservative (3.0-5.0): Only extreme divergences Default: 1.5 - best risk/reward balance
Path Memory (20-200 bars)
Short Memory (20-50): Recent behavior focus, quick adaptation
Medium Memory (50-100): Balanced historical context
Long Memory (100-200): Emphasizes established patterns Default: 50 - captures sufficient history without lag
Signal Spacing (5-50 bars)
Aggressive (5-10): Allows rapid-fire signals
Normal (15-25): Prevents clustering, maintains flow
Conservative (30-50): Major setups only Default: 15 - optimal trade frequency
Ensemble Configuration
Select markets for consensus analysis:
SPY: Broad market sentiment
QQQ: Technology leadership
IWM: Small-cap risk appetite
DIA: Blue-chip stability
More instruments = stronger consensus but potentially diluted signals
Visual Customization
Color Themes (6 professional options):
Quantum: Cyan/Pink - Modern trading aesthetic
Matrix: Green/Red - Classic terminal look
Heat: Blue/Red - Temperature metaphor
Neon: Cyan/Magenta - High contrast
Ocean: Turquoise/Coral - Calming palette
Sunset: Red-orange/Teal - Warm gradients
Display Controls:
- Toggle each visual component
- Adjust transparency levels
- Scale dashboard text
- Show/hide confidence scores
- Trading Strategies by Market State
- Ergodic State Strategy (Primary Color Bands)
Market Characteristics
- Price oscillates predictably
- Support/resistance hold
- Volume patterns repeat
- Mean reversion dominates
Optimal Approach
Entry: Fade moves at band extremes
Target: Middle band (equilibrium)
Stop: Just beyond outer bands
Size: Full confidence-based position
Recommended Tools
- RSI for oversold/overbought
- Bollinger Bands for extremes
- Volume profile for levels
- Non-Ergodic State Strategy (Danger Color Bands)
Market Characteristics
- Price trends persistently
- Levels break decisively
- Volume confirms direction
- Momentum accelerates
Optimal Approach
Entry: Breakout from bands
Target: Trail with expanding bands
Stop: Inside opposite band
Size: Scale in with trend
Recommended Tools
- Moving average alignment
- ADX for trend strength
- MACD for momentum
- Advanced Features Explained
Quantum Coherence Metric
Measures phase alignment between individual and ensemble behavior:
80-100%: Perfect sync - strong mean reversion setup
50-80%: Moderate alignment - mixed signals
0-50%: Decoherence - trending behavior likely
Path Dependency Analysis
Quantifies how much history influences current price:
Low (<30%): Technical patterns reliable
Medium (30-50%): Mixed influences
High (>50%): Fundamental shift occurring
Volatility Regime Classification
Contextualizes current volatility:
Normal: Standard strategies apply
Elevated: Widen stops, reduce size
Extreme: Defensive mode required
Signal Strength Indicator
Real-time opportunity quality:
- Distance from threshold
- Momentum acceleration
- Cross-validation factors
Risk Management Framework
Position Sizing by Confidence
90%+ confidence = 100% position size
70-90% confidence = 75% position size
50-70% confidence = 50% position size
<50% confidence = 25% or skip
Dynamic Stop Placement
Ergodic State: ATR × 1.0 from entry
Non-Ergodic State: ATR × 2.0 from entry
Volatility Adjustment: Multiply by current regime
Multi-Timeframe Alignment
- Check higher timeframe regime
- Confirm ensemble consensus
- Verify volume participation
- Align with major levels
What Makes EMD Unique
Original Contributions
First Ergodic Theory Trading Application: Transforms abstract physics into practical signals
Ensemble Market Analysis: Revolutionary multi-market divergence system
Adaptive Confidence Engine: Institutional-grade signal quality metrics
Quantum Coherence: Novel market alignment measurement
Smart Signal Management: Prevents clustering while maintaining responsiveness
Technical Innovations
Dynamic Threshold Adaptation: Self-adjusting sensitivity
Path Memory Integration: Historical dependency weighting
Stress-Adjusted Scoring: Market condition normalization
Real-Time Performance Tracking: Built-in strategy analytics
Optimization Guidelines
By Timeframe
Scalping (1-5 min)
Period: 10-15
Threshold: 0.5-1.0
Memory: 20-30
Spacing: 5-10
Day Trading (5-60 min)
Period: 20-30
Threshold: 1.5-2.5
Memory: 40-60
Spacing: 15-20
Swing Trading (1H-1D)
Period: 40-60
Threshold: 2.0-3.0
Memory: 80-120
Spacing: 25-35
Position Trading (1D-1W)
Period: 60-100
Threshold: 3.0-5.0
Memory: 100-200
Spacing: 40-50
By Market Condition
Trending Markets
- Increase threshold
- Extend memory
- Focus on breaks
Ranging Markets
- Decrease threshold
- Shorten memory
- Focus on restores
Volatile Markets
- Increase spacing
- Raise confidence requirement
- Reduce position size
- Integration with Other Analysis
- Complementary Indicators
For Ergodic States
- RSI divergences
- Bollinger Band squeezes
- Volume profile nodes
- Support/resistance levels
For Non-Ergodic States
- Moving average ribbons
- Trend strength indicators
- Momentum oscillators
- Breakout patterns
- Fundamental Alignment
- Check economic calendar
- Monitor sector rotation
- Consider market themes
- Evaluate risk sentiment
Troubleshooting Guide
Too Many Signals:
- Increase threshold
- Extend signal spacing
- Raise confidence minimum
Missing Opportunities
- Decrease threshold
- Reduce signal spacing
- Check ensemble settings
Poor Win Rate
- Verify timeframe alignment
- Confirm volume participation
- Review risk management
Disclaimer
This indicator is for educational and informational purposes only. It does not constitute financial advice. Trading involves substantial risk of loss and is not suitable for all investors. Past performance does not guarantee future results.
The ergodic framework provides unique market insights but cannot predict future price movements with certainty. Always use proper risk management, conduct your own analysis, and never risk more than you can afford to lose.
This tool should complement, not replace, comprehensive trading strategies and sound judgment. Markets remain inherently unpredictable despite advanced analysis techniques.
Transform market chaos into trading clarity with Ergodic Market Divergence.
Created with passion for the TradingView community
Trade with insight. Trade with anticipation.
— Dskyz , for DAFE Trading Systems

CPD Approach Algo Line [ValiantTrader]CPD Approach Algo Line Indicator - Explanation
This indicator, developed by ValiantTrader, is a sophisticated tool for analyzing price action and volume distribution across different timeframes. Here's how it works and how traders can use it:
Core Functionality
The indicator performs a "Candle Price Distribution" (CPD) analysis by:
Collecting data from a higher timeframe (configurable via input)
Dividing the price range into horizontal zones (either by tick size or evenly distributed)
Analyzing price behavior within each zone
Key Features and Trading Applications
1. Price Zone Analysis
Divides the price range into customizable zones (default 24 zones)
Shows how many candles have traded in each zone
Displays what percentage of total candles occurred in each zone
Trading Use: Identifies high-probability support/resistance areas where price has historically spent more time.
2. Delta Calculation
Shows the difference in candle counts between adjacent zones
Color-coded (green for positive, red for negative)
Trading Use: Helps spot areas where price behavior changes significantly (potential reversal zones).
3. Volume Clusters
Aggregates volume traded within each price zone
Visualized as colored backgrounds
Trading Use: Identifies high-volume nodes which often act as strong support/resistance.
4. Pressure Zones
Scores each zone based on where candles closed within the zone
Positive pressure (green) when candles closed in upper part
Negative pressure (red) when candles closed in lower part
Trading Use: Shows where buyers or sellers were more dominant at each price level.
5. Advanced Candle Pattern Detection
Tracks wick engulfing patterns
Measures body engulfing patterns
Counts rejection candles (long wicks)
Identifies dominant candles (large bodies)
Trading Use: Provides additional confirmation of potential reversal or continuation patterns.
6. Draggable Reference Line
Allows traders to place a horizontal line at any price level
Automatically shows statistics for the zone containing the line
Trading Use: Quickly analyze any price level's historical significance.
Practical Trading Applications
Support/Resistance Identification: The zones with highest candle counts typically represent strong support/resistance levels.
Breakout Trading: When price moves into zones with few previous candles, it may indicate breakout potential.
Reversal Trading: Zones where delta changes significantly (from positive to negative or vice versa) can signal potential reversals.
Volume-Weighted Analysis: Combining candle counts with volume clusters helps identify the most significant price levels.
Multi-Timeframe Analysis: By setting the custom timeframe to a higher period, traders can see where institutional levels exist on weekly/daily charts while trading on lower timeframes.
The indicator is particularly useful for traders who employ volume profile, market profile, or order flow concepts in their trading strategy. The visual presentation makes it easy to quickly assess the most significant price levels on any chart.

Value Zones [Influxum]The volume of traded contracts at a specific price level is, in our opinion, one of the most critical components of any trading system. The area where price acceptance occurred, and the most contracts were traded, represents a very objective phenomenon on the chart, reducing the degree of discretionary trading. This is commonly referred to as POC – Point of Control – the point where the most units of an instrument were traded. Our Value Zones take this a step further by identifying additional local extremes, i.e., areas where significant trading volumes occurred locally at specific prices. This provides objective information about the points on the market where buyers and sellers agreed on a price, resulting in what is known as consolidation. This information can help identify the price levels or zones where aggressive buyer or seller behavior, and consequently a significant price reaction, might be expected. We do not perceive the POC or local extremes as mere price levels but rather as zones. The distribution of trades in the market is a stochastic process, and deviations can occur, which is why we extend local extremes and the POC with a coefficient reflecting the current session's volatility.
🟪 General Settings
Session
Value Zones are always calculated for a specific time period. In this section, you can set whether you want to see Value Zones for 30-minute candles, hourly charts, 4-hour charts, daily, weekly, or monthly timeframes. Keep in mind the timeframe you are currently viewing. If you attempt to display monthly Value Zones on minute candles, the chart will typically load only 10,000 to 20,000 candles, representing a maximum of 20 days, which is insufficient for accurately determining monthly Value Zones.
Levels of Detai l
To simplify working with Value Zones, you don’t need to manually set the size of a single row in the volume profile in terms of ticks. Simply choose how many rows the entire range of the selected session should be divided into. Local maxima will then be identified within the specified number of rows. The more rows you choose, the more detailed the Value Zones will be. However, this may lead to identifying local extremes too close to each other (in cases where consolidation has occurred for a longer period). We recommend an optimal setting of 50 to 100 rows to ensure the significant local extremes are effectively visualized.
Volume Type
An interesting metric is not just the volume traded at a price but also the ratio of buy and sell volumes – the delta. Based on the data available, this is not a precise tick-based or bid-ask delta but rather a delta derived from the volume of candles on lower timeframes. For daily sessions, for instance, we use minute candles. If a candle closes higher than it opens, it is considered positive delta. If it closes lower, it is negative delta. This helps identify whether buyers or sellers were more aggressive at a specific price level (not whether there were more buyers or sellers, as each trade always involves both sides).
🟪 Heatmap
A heatmap visualizes the volume profile, displaying volume on a given row through color intensity. For standard volume, the intensity represents a single color. For delta, separate colors are used to represent positive and negative delta intensity.
Align
Choose whether the Heatmap will always appear on the right or left side. If set to the right, historical Heatmaps will display at the start of the next session after the session concludes. A developing session’s Heatmap will appear on the right in real time. If set to the left, the Heatmap will always appear at the start of the session it represents. For a developing session, the Heatmap is also on the left. Note that right after the session begins, the Heatmap may look unusual because there isn’t yet enough price data to calculate all the rows (e.g., the 50 rows set in Levels of Detail).
Heatmap Length
This determines the Heatmap’s length in terms of the number of candles.
Color Settings
You can configure colors separately for Volume and Delta modes. The color settings for POC are shared for both modes.
🟪 Local Peaks
Draw Local Peaks
Here, you can set how local peaks (in addition to POC) will be displayed. If set to "None," neither POC nor any local extreme will be shown. You can choose to display POC and local peaks as lines, boxes, or both.
Number of Local Peaks
If set to 0 and a display mode for POC and local extremes (line, box, or both) is active, only the POC will be displayed. Any value higher than 0 will display that number of local extremes, as long as they are found. If the Level of Detail is set too low, no local extremes might be identified.
🟪 Visuals - Historical & Current
To tailor your chart to your preferences, you can freely customize the colors for local peaks and POC, lines and boxes, and even differentiate between historical and developing values. The choice is entirely yours!

Range Detect SystemTechnical analysis indicator designed to identify potential significant price ranges and the distribution of volume within those ranges. The system helps traders calculate POC and show volume history. Also detecting breakouts or potential reversals. System identifies ranges with a high probability of price consolidation and helps screen out extreme price moves or ranges that do not meet certain volatility thresholds.
⭕️ Key Features
Range Detection — identifies price ranges where consolidation is occurring.
Volume Profile Calculation — indicator calculates the Point of Control (POC) based on volume distribution within the identified range, enhancing the analysis of market structure.
Volume History — shows where the largest volume was traded from the center of the range. If the volume is greater in the upper part of the range, the color will be green. If the volume is greater in the lower part, the color will be red.
Range Filtering — Includes multi-level filtering options to avoid ranges that are too volatile or outside normal ranges.
Visual Customization — Shows graphical indicators for potential bullish or bearish crossovers at the upper and lower range boundaries. Users can choose the style and color of the lines, making it easier to visualize ranges and important levels on the chart.
Alerts — system will notify you when a range has been created and also when the price leaves the range.
⭕️ How it works
Extremes (Pivot Points) are taken as a basis, after confirming the relevance of the extremes we take the upper and lower extremes and form a range. We check if it does not violate a number of rules and filters, perform volume calculations, and only then is the range displayed.
Pivot points is a built-in feature that shows an extremum if it has not been updated N bars to the left and N bars to the right. Therefore, there is a delay depending on the bars specified to check, which allows for a more accurate range. This approach allows not to make unnecessary recalculations, which completely eliminates the possibility of redrawing or range changes.
⭕️ Settings
Left Bars and Right Bars — Allows you to define the point that is the highest among the specified number of bars to the left and right of this point.
Range Logic — Select from which point to draw the range. Maximums only, Minimums only or both.
Use Wick — Option to consider the wick of the candles when identifying Range.
Breakout Confirmation — The number of bars required to confirm a breakout, after which the range will close.
Minimum Range Length — Sets the minimum number of candles needed for a range to be considered valid.
Row Size — Number of levels to calculate POC. *Larger values increase the script load.
% Range Filter — Dont Show Range is than more N% of Average Range.
Multi Filter — Allows use of Bollinger Bands, ATR, SMA, or Highest-Lowest range channels for filtering ranges based on volatility.
Range Hit — Shows graphical labels when price hits the upper or lower boundaries of the range, signaling potential reversal or breakout points.
Range Start — Show points where Range was created.

Linear Regression Channel UltimateKey Features and Benefits
Logarithmic scale option for improved analysis of long-term trends and volatile markets
Activity-based profiling using either touch count or volume data
Customizable channel width and number of profile fills
Adjustable number of most active levels displayed
Highly configurable visual settings for optimal chart readability
Why Logarithmic Scale Matters
The logarithmic scale option is a game-changer for analyzing assets with exponential growth or high volatility. Unlike linear scales, log scales represent percentage changes consistently across the price range. This allows for:
Better visualization of long-term trends
More accurate comparison of price movements across different price levels
Improved analysis of volatile assets or markets experiencing rapid growth
How It Works
The indicator calculates a linear regression line based on the specified period
Upper and lower channel lines are drawn at a customizable distance from the regression line
The space between the channel lines is divided into a user-defined number of levels
For each level, the indicator tracks either:
- The number of times price touches the level (touch count method)
- The total volume traded when price is at the level (volume method)
The most active levels are highlighted based on this activity data
Understanding Touch Count vs Volume
Touch count method: Useful for identifying key support/resistance levels based on price action alone
Volume method: Provides insight into levels where the most trading activity occurs, potentially indicating stronger support/resistance
Practical Applications
Trend identification and strength assessment
Support and resistance level discovery
Entry and exit point optimization
Volume profile analysis for improved market structure understanding
This Linear Regression Channel indicator combines powerful statistical analysis with flexible visualization options, making it an invaluable tool for traders and analysts across various timeframes and markets. Its unique features, especially the logarithmic scale and activity profiling, provide deeper insights into market behavior and potential turning points.

Price-Volume Dynamic - Strategy [presentTrading]█ Introduction and How it is Different
The "Price-Volume Dynamic - Strategy" leverages a unique blend of price action, volume analysis, and statistical z-scores to establish trading positions. This approach differentiates itself by integrating the concept of the Point of Control (POC) from volume profile analysis with price-based z-score indicators to create a dynamic trading strategy. It tailors entry and exit thresholds based on current market volatility, providing a responsive and adaptive trading method. This strategy stands out by considering both historical volatility and price trends to adjust trading decisions in real-time, enhancing its effectiveness in various market conditions.
BTCUSD 4h LS Performance
█ Strategy: How It Works – Detailed Explanation
🔶 Calculating Point of Control (POC)
The Point of Control (POC) represents the price level with the highest traded volume over a specified lookback period. It's calculated by dividing the price range into a number of rows, each representing a price level. The volume at each price level is tallied and the level with the maximum volume is designated as the POC.
🔶 Dynamic Thresholds Adjustments
The entry and exit thresholds are dynamically adjusted based on normalized volatility, which is derived from the current, minimum, and maximum ATR over a specified period. This normalization ensures that the thresholds adapt to changes in market conditions, making the strategy sensitive to shifts in market volatility.
BTCUSD local performance
█ Trade Direction
The strategy can be configured to trade in three different directions: Long, Short, or Both. This flexibility allows traders to align their trading strategy with their market outlook or risk preferences. By adjusting the `POC_tradeDirection` input, traders can selectively participate in market movements that match their trading style and objectives.
█ Usage
To deploy this strategy, traders should apply it within a trading software that supports scripting and backtesting, such as TradingView's Pine Script environment. Users can input their parameters based on their analysis of the market conditions and their risk tolerance. It is essential for traders to backtest the strategy using historical data to evaluate its performance and make necessary adjustments before applying it in live trading scenarios.
█ Default Settings
- Lookback Length: Sets the period over which the highest and lowest prices, and the volume per price level, are calculated. A higher lookback length smoothens the volatility but may delay response to recent market movements.
- Number of Rows: Determines the granularity of price levels within the price range. More rows provide a more detailed volume profile but require more computational resources.
- Entry Z-Score Threshold Base: Influences the sensitivity of the strategy to enter trades. Higher values make the strategy more conservative, requiring stronger deviation from the mean to trigger a trade.
- Exit Z-Score Threshold Base: Sets the threshold for exiting trades, with lower values allowing trades to close on smaller price retractions, thereby potentially preserving profits or reducing losses.
- Trading Direction: Allows selection between Long, Short, or Both, enabling traders to tailor the strategy to their market view or risk preferences.
